OPEN-SOURCE SCRIPT
Diupdate DJ Soori Trading Strategy

The strategy combines three indicators: Exponential Moving Average (EMA), Weighted Moving Average (WMA), and Average Directional Index (ADX).
The EMA and WMA are used to track the average price over different time periods.
The ADX measures the strength of a trend in the market.
The strategy generates buy signals when the EMA is higher than the WMA and the ADX is above a certain threshold. It suggests a potential uptrend.
It generates sell signals when the EMA is lower than the WMA and the ADX is above the threshold. It suggests a potential downtrend.
The strategy also considers whether the ADX is rising or falling to indicate the strength of the trend.
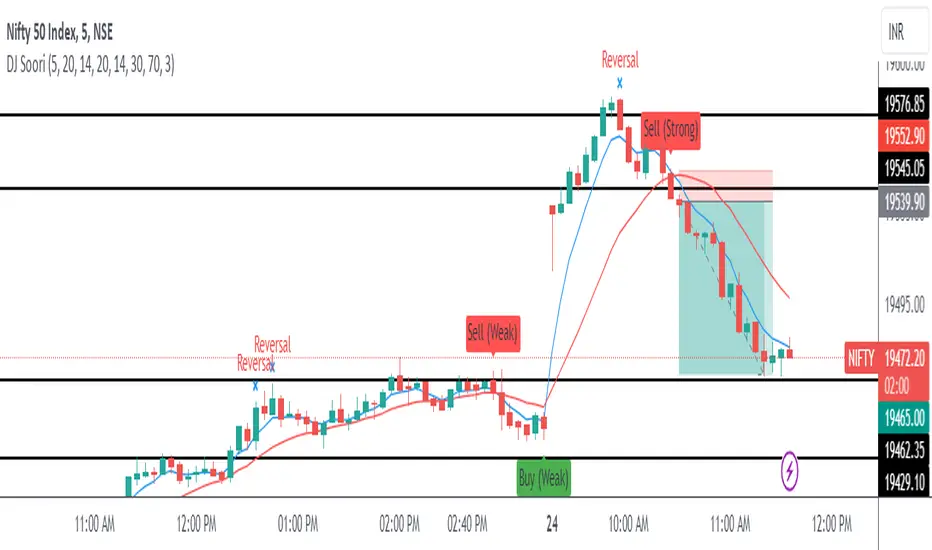
The EMA, WMA, and ADX values are plotted on the chart.
Buy and sell signals are shown as labels on the chart, indicating "Buy (Strong)" or "Buy (Weak)" for buy signals, and "Sell (Strong)" or "Sell (Weak)" for sell signals.
Catatan Rilis
The strategy combines three indicators: Exponential Moving Average (EMA), Weighted Moving Average (WMA), and Average Directional Index (ADX).EMA and WMA track the average price over different time periods.
ADX measures the strength of a trend in the market.
Buy signals:
Generated when EMA is higher than WMA and ADX is above a threshold.
Indicates a potential uptrend.
Sell signals:
Generated when EMA is lower than WMA and ADX is above the threshold.
Indicates a potential downtrend.
The strategy considers the rising or falling nature of ADX to assess the strength of the trend.
The chart displays the EMA, WMA, and ADX values.
Buy and sell signals are indicated on the chart as labels:
"Buy (Strong)" or "Buy (Weak)" for buy signals.
"Sell (Strong)" or "Sell (Weak)" for sell signals.
This strategy helps identify potential trends and provides buy/sell signals based on the EMA-WMA crossover and ADX strength.
Catatan Rilis
Updated barstate codes Catatan Rilis
Book profit has been changed to reversal signCatatan Rilis
Some new changes added Catatan Rilis
Updated EMA and WMASkrip open-source
Dengan semangat TradingView yang sesungguhnya, pembuat skrip ini telah menjadikannya sebagai sumber terbuka, sehingga para trader dapat meninjau dan memverifikasi fungsinya. Salut untuk penulisnya! Meskipun Anda dapat menggunakannya secara gratis, perlu diingat bahwa penerbitan ulang kode ini tunduk pada Tata Tertib kami.
Pernyataan Penyangkalan
Informasi dan publikasi ini tidak dimaksudkan, dan bukan merupakan, saran atau rekomendasi keuangan, investasi, trading, atau jenis lainnya yang diberikan atau didukung oleh TradingView. Baca selengkapnya di Ketentuan Penggunaan.
Skrip open-source
Dengan semangat TradingView yang sesungguhnya, pembuat skrip ini telah menjadikannya sebagai sumber terbuka, sehingga para trader dapat meninjau dan memverifikasi fungsinya. Salut untuk penulisnya! Meskipun Anda dapat menggunakannya secara gratis, perlu diingat bahwa penerbitan ulang kode ini tunduk pada Tata Tertib kami.
Pernyataan Penyangkalan
Informasi dan publikasi ini tidak dimaksudkan, dan bukan merupakan, saran atau rekomendasi keuangan, investasi, trading, atau jenis lainnya yang diberikan atau didukung oleh TradingView. Baca selengkapnya di Ketentuan Penggunaan.