OPEN-SOURCE SCRIPT
MFIww2 MFI/RSI [wozdux]
Bill Williams indicator (MFI).
The indicator calculates the range of oscillations per unit volume. In fact, this indicator shows the tick volume or the readiness of the market to move the price.
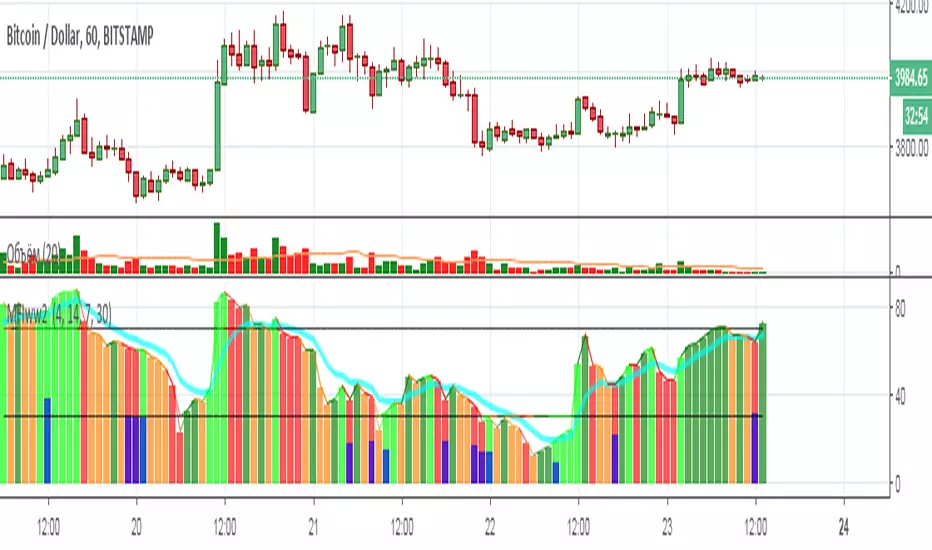
The indicator is presented as vertical columns or as a line with levels.
Vertical columns are painted in different colors depending on the displacement of the indicator and the displacement of the volume. The indicator can increase or decrease (+-). The volume can also increase or decrease (+-). The combination of these factors generates four types of indicator columns.
++ lime
+- dark green
-+ red
-- orange
The red bar on Williams is a squat bar. This bar is important for market reversal indication.
-------------------------------
Индикатор Билла Вильямса (MFI).
Индикатор вычисляет диапазон колебаний на единицу объема. Фактически этот индикатор показывает тиковый объем или готовность рынка переместить цену.
Индикатор представлен в виде вертикальных колонок или в виде линии с уровнями.
Вертикальные колонки раскрашены в различные цвета в зависимости от смещения индикатора и смещения объема. Индикатор может увеличиваться или уменьшаться (+-). Объем также может увеличиваться или уменьшаться (+-). Сочетание этих факторо порождает четыре вида столбиков индикатора.
++ салатный
+- темно-зеленый
-+ красный
-- оранжевый
Красный столбик по Вильямсу есть приседающий бар. Этот бар важен для индикации разворота рынка.
The indicator calculates the range of oscillations per unit volume. In fact, this indicator shows the tick volume or the readiness of the market to move the price.
The indicator is presented as vertical columns or as a line with levels.
Vertical columns are painted in different colors depending on the displacement of the indicator and the displacement of the volume. The indicator can increase or decrease (+-). The volume can also increase or decrease (+-). The combination of these factors generates four types of indicator columns.
++ lime
+- dark green
-+ red
-- orange
The red bar on Williams is a squat bar. This bar is important for market reversal indication.
-------------------------------
Индикатор Билла Вильямса (MFI).
Индикатор вычисляет диапазон колебаний на единицу объема. Фактически этот индикатор показывает тиковый объем или готовность рынка переместить цену.
Индикатор представлен в виде вертикальных колонок или в виде линии с уровнями.
Вертикальные колонки раскрашены в различные цвета в зависимости от смещения индикатора и смещения объема. Индикатор может увеличиваться или уменьшаться (+-). Объем также может увеличиваться или уменьшаться (+-). Сочетание этих факторо порождает четыре вида столбиков индикатора.
++ салатный
+- темно-зеленый
-+ красный
-- оранжевый
Красный столбик по Вильямсу есть приседающий бар. Этот бар важен для индикации разворота рынка.
Skrip open-source
Dengan semangat TradingView yang sesungguhnya, pembuat skrip ini telah menjadikannya sebagai sumber terbuka, sehingga para trader dapat meninjau dan memverifikasi fungsinya. Salut untuk penulisnya! Meskipun Anda dapat menggunakannya secara gratis, perlu diingat bahwa penerbitan ulang kode ini tunduk pada Tata Tertib kami.
Pernyataan Penyangkalan
Informasi dan publikasi ini tidak dimaksudkan, dan bukan merupakan, saran atau rekomendasi keuangan, investasi, trading, atau jenis lainnya yang diberikan atau didukung oleh TradingView. Baca selengkapnya di Ketentuan Penggunaan.