OPEN-SOURCE SCRIPT
Diupdate Crunchster's Real Price
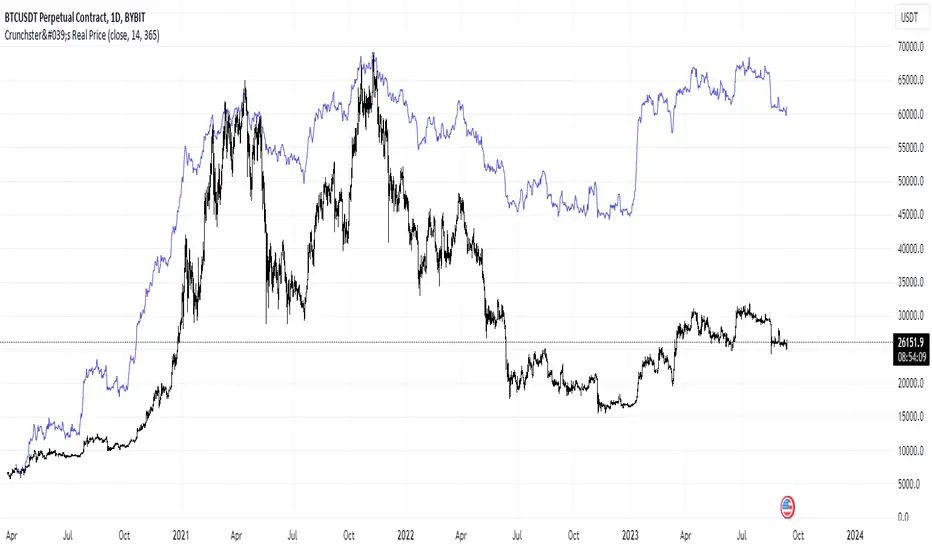
This is a simple transformation of any price series (best suited to daily timeframe) that filters out random price fluctuations and revealing the "real" price action. It allows comparison between different assets easily and is a useful confirmation of support and resistance levels, or can be used with other technical analysis.
In the default settings based on a daily chart, the daily returns are first calculated, then volatility normalised by dividing by the standard deviation of daily returns over the defined lookback period (14 periods by default).
These normalised returns are then added together over the entire price series period, to create a new "Real price" - the volatility adjusted price. This is the default presentation.
In addition, a second signal ("Normalised price series over rolling period") is available which, instead of summing the normalised returns over the entire price series, allows a user configurable, rolling lookback window over which the normalised returns are summed up. The default setting is 365 periods (ie 1 year on the daily timeframe for tickers with 24hr markets such as crypto. This can be set to 252 periods if analysing equities, which only trade 5 days per week, or any other user defined period of interest).
Catatan Rilis
Added configurable sourceCatatan Rilis
Updated to overlay main chartSkrip open-source
Dengan semangat TradingView yang sesungguhnya, pembuat skrip ini telah menjadikannya sebagai sumber terbuka, sehingga para trader dapat meninjau dan memverifikasi fungsinya. Salut untuk penulisnya! Meskipun Anda dapat menggunakannya secara gratis, perlu diingat bahwa penerbitan ulang kode ini tunduk pada Tata Tertib kami.
Join me on Mizar.com and trade my strategies
Pernyataan Penyangkalan
Informasi dan publikasi ini tidak dimaksudkan, dan bukan merupakan, saran atau rekomendasi keuangan, investasi, trading, atau jenis lainnya yang diberikan atau didukung oleh TradingView. Baca selengkapnya di Ketentuan Penggunaan.
Skrip open-source
Dengan semangat TradingView yang sesungguhnya, pembuat skrip ini telah menjadikannya sebagai sumber terbuka, sehingga para trader dapat meninjau dan memverifikasi fungsinya. Salut untuk penulisnya! Meskipun Anda dapat menggunakannya secara gratis, perlu diingat bahwa penerbitan ulang kode ini tunduk pada Tata Tertib kami.
Join me on Mizar.com and trade my strategies
Pernyataan Penyangkalan
Informasi dan publikasi ini tidak dimaksudkan, dan bukan merupakan, saran atau rekomendasi keuangan, investasi, trading, atau jenis lainnya yang diberikan atau didukung oleh TradingView. Baca selengkapnya di Ketentuan Penggunaan.