OPEN-SOURCE SCRIPT
K線虛擬幣
// This source code is subject to the terms of the Mozilla Public License 2.0 at mozilla.org/MPL/2.0/
// © dear.simpson
//version=5
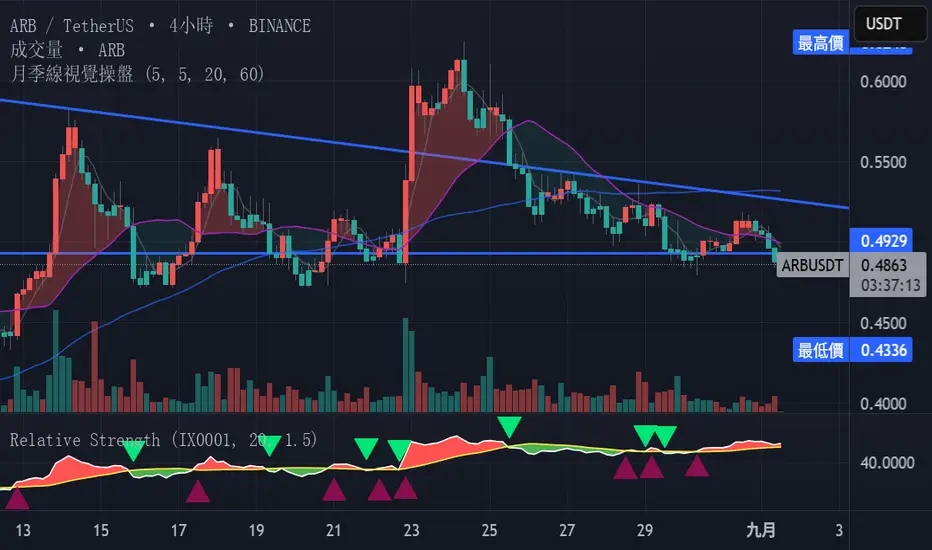
indicator("月季線視覺操盤", "", true)
// Getting inputs
length = input(5, "操盤線週期")
// Calculating
ma = ta.sma(close, length)
spread = close-ma
// Plotcandle
plotcandle(open, high, low, close, title='操盤K線', editable = false , display =display.pane+display.price_scale , color = (spread>=0 ? #ef5350 : #26a69a) , bordercolor= (spread>=0 ? #ef5350 : #26a69a) , wickcolor = #5d606b)
// Getting inputs
maPeriods1 = input( 5 , "MA 1" , group="移動平均線")
maPeriods2 = input(20 , "MA 2" , group="移動平均線")
maPeriods3 = input(60 , "MA 3" , group="移動平均線")
line0 = ta.sma(close, 2)
line1 = ta.sma(close, maPeriods1)
line2 = ta.sma(close, maPeriods2)
line3 = ta.sma(close, maPeriods3)
// Plot Moving Average Line
p0PlotID = plot(line0 ,"MA 0" , color.new(color.black ,100), display = display.none , editable = false)
p1PlotID = plot(line1 ,"MA 1" , color.new(#787b86, 50), display = display.pane+display.price_scale )
p2PlotID = plot(line2 ,"MA 2" , color.new(#787b86, 0), display = display.pane+display.price_scale )
p3PlotID = plot(line3 ,"MA 3" , color.new(color.blue , 30), display = display.pane+display.price_scale )
// Plot Zone Color
fill(p0PlotID, p2PlotID, close > line2 ? color.new(#ef5350, 70) : color.new(#26a69a, 90), '高/低於月線區域顏色')
fill(p0PlotID, p3PlotID, close > line3 ? color.new(#ef5350, 70) : color.new(#26a69a, 90), '高/低於季線區域顏色' , display = display.none )
// © dear.simpson
//version=5
indicator("月季線視覺操盤", "", true)
// Getting inputs
length = input(5, "操盤線週期")
// Calculating
ma = ta.sma(close, length)
spread = close-ma
// Plotcandle
plotcandle(open, high, low, close, title='操盤K線', editable = false , display =display.pane+display.price_scale , color = (spread>=0 ? #ef5350 : #26a69a) , bordercolor= (spread>=0 ? #ef5350 : #26a69a) , wickcolor = #5d606b)
// Getting inputs
maPeriods1 = input( 5 , "MA 1" , group="移動平均線")
maPeriods2 = input(20 , "MA 2" , group="移動平均線")
maPeriods3 = input(60 , "MA 3" , group="移動平均線")
line0 = ta.sma(close, 2)
line1 = ta.sma(close, maPeriods1)
line2 = ta.sma(close, maPeriods2)
line3 = ta.sma(close, maPeriods3)
// Plot Moving Average Line
p0PlotID = plot(line0 ,"MA 0" , color.new(color.black ,100), display = display.none , editable = false)
p1PlotID = plot(line1 ,"MA 1" , color.new(#787b86, 50), display = display.pane+display.price_scale )
p2PlotID = plot(line2 ,"MA 2" , color.new(#787b86, 0), display = display.pane+display.price_scale )
p3PlotID = plot(line3 ,"MA 3" , color.new(color.blue , 30), display = display.pane+display.price_scale )
// Plot Zone Color
fill(p0PlotID, p2PlotID, close > line2 ? color.new(#ef5350, 70) : color.new(#26a69a, 90), '高/低於月線區域顏色')
fill(p0PlotID, p3PlotID, close > line3 ? color.new(#ef5350, 70) : color.new(#26a69a, 90), '高/低於季線區域顏色' , display = display.none )
Skrip open-source
Dengan semangat TradingView yang sesungguhnya, pembuat skrip ini telah menjadikannya sebagai sumber terbuka, sehingga para trader dapat meninjau dan memverifikasi fungsinya. Salut untuk penulisnya! Meskipun Anda dapat menggunakannya secara gratis, perlu diingat bahwa penerbitan ulang kode ini tunduk pada Tata Tertib kami.
Pernyataan Penyangkalan
Informasi dan publikasi ini tidak dimaksudkan, dan bukan merupakan, saran atau rekomendasi keuangan, investasi, trading, atau jenis lainnya yang diberikan atau didukung oleh TradingView. Baca selengkapnya di Ketentuan Penggunaan.