OPEN-SOURCE SCRIPT
Bar Bodies [vnhilton]
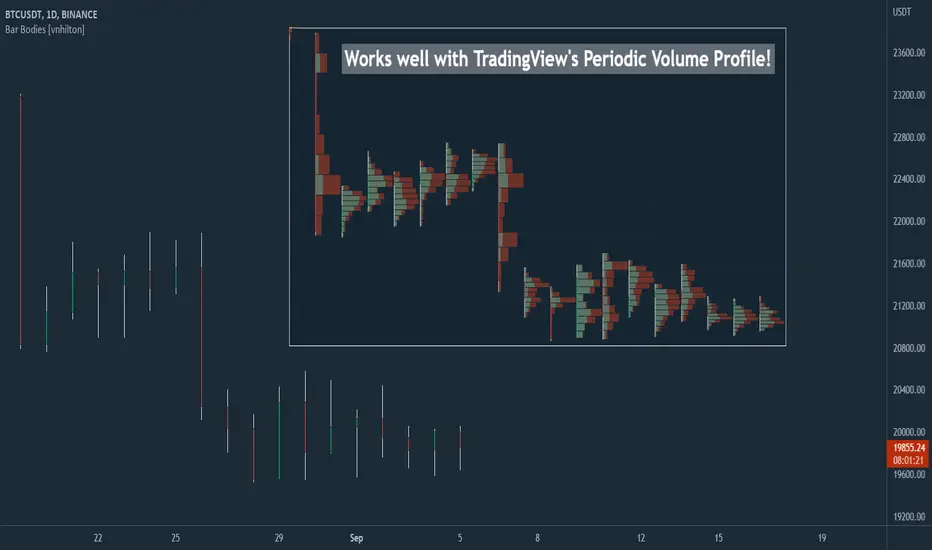
Note: Go to "Chart Settings" & hide "Body" & "Borders". Also uncheck "Labels on price scale" & "Values in status line" as they're not needed.
This script plots candlestick bodies with the same thickness as the wicks (similar to the bar chart, but without the horizontal lines to represent the open & close). To do this, it plots an invisible candlestick body with an invisible candlestick border from the high to the close/open for a green/red candle respectively, & uses the low wick as the candlestick body itself by plotting it from the low price to the open/close for a green/red candle respectively.
My personal use for this script is to use it in conjunction with TradingView's Periodic Volume Profile, in order to still see OHLC data without obstructing the candlesticks' volume profiles, as seen in the chart snapshot image above.
Skrip open-source
Dengan semangat TradingView yang sesungguhnya, pembuat skrip ini telah menjadikannya sebagai sumber terbuka, sehingga para trader dapat meninjau dan memverifikasi fungsinya. Salut untuk penulisnya! Meskipun Anda dapat menggunakannya secara gratis, perlu diingat bahwa penerbitan ulang kode ini tunduk pada Tata Tertib kami.
Pernyataan Penyangkalan
Informasi dan publikasi ini tidak dimaksudkan, dan bukan merupakan, saran atau rekomendasi keuangan, investasi, trading, atau jenis lainnya yang diberikan atau didukung oleh TradingView. Baca selengkapnya di Ketentuan Penggunaan.