OPEN-SOURCE SCRIPT
Diupdate Volume Pressure
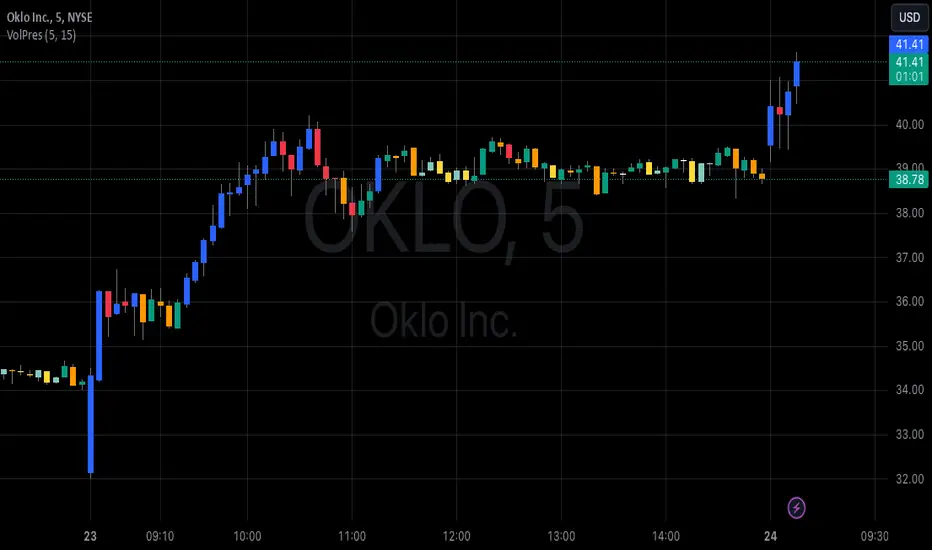
Draws the candle chart with colors to represent low, medium and high volumes. You get 3 colors for downward and 3 colors for upward movement. This will aid with immediately seeing the relative volume pushing the stock candle in the direction of movement.
You can control the percentage threshold for low and high volume. You also can change the colors to represent each volume level for upward and downward movement.
You can control the percentage threshold for low and high volume. You also can change the colors to represent each volume level for upward and downward movement.
Catatan Rilis
Draws the candle chart with colors to represent low, medium and high volumes. You get 3 colors for downward and 3 colors for upward movement. This will aid with immediately seeing the relative volume pushing the stock candle in the direction of movement.You can control the percentage threshold for low and high volume. You also can change the colors to represent each volume level for upward and downward movement.
Skrip open-source
Dengan semangat TradingView yang sesungguhnya, pembuat skrip ini telah menjadikannya sebagai sumber terbuka, sehingga para trader dapat meninjau dan memverifikasi fungsinya. Salut untuk penulisnya! Meskipun Anda dapat menggunakannya secara gratis, perlu diingat bahwa penerbitan ulang kode ini tunduk pada Tata Tertib kami.
Pernyataan Penyangkalan
Informasi dan publikasi ini tidak dimaksudkan, dan bukan merupakan, saran atau rekomendasi keuangan, investasi, trading, atau jenis lainnya yang diberikan atau didukung oleh TradingView. Baca selengkapnya di Ketentuan Penggunaan.