OPEN-SOURCE SCRIPT
Fibonacci Muti-MA Ribbon
Welcome some, welcome small.... This is CryptoFilio, your dark knight in the crypto light - shining down my infinite wisdom upon this wasteland we call the "markets". It's me and you against the machine... so rage, rage, rage against the dying of the night!
DESCRIPTION
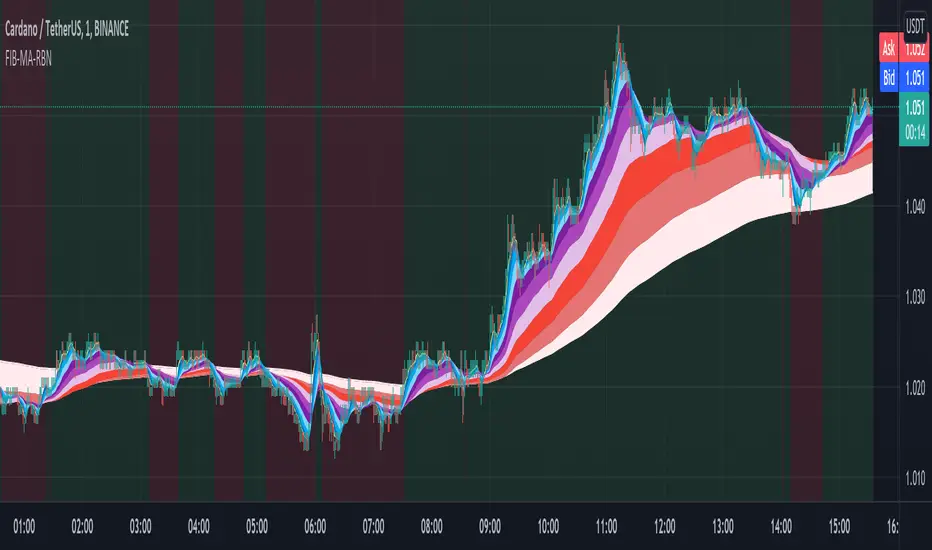
This indicator exemplifies the beauty of the sacred Fibonacci sequence.... used by flowers and seashells and the intrepid day trader. Each color in the ribbon represents an MA of a specific FIB lookback period. This naturally makes the ribbon front weighted, giving recent price action greater importance than older price action. The undulating curls of the ribbon allow a trader to see key convergences and divergences. The ribbon often narrows before a major price movement.
The background is lightly colored to indicate when one average of MA's crosses the other average (1+2+3+4+5) crosses (6+7+8+9+10). Like a standard MA cross, but a little more sophisticated.
The most visually pleasing is SMMA-RMA, but the more effective in anticipating the market is EMA and HMA.
USAGE
Visualizing convergence and divergence as the ribbon widens with sudden price movement and narrows during consolidation
Visualizing general trends as the flipping over of the ribbon represents a general trend change
Setting possible entry and exit points through the width and direction of the ribbon
VARIATIONS
You can select many types of MA's, such as SMA,EMA,HMA,VWMA... and a couple of others. The most effective seem to be EMA,HMA, and VWMA
SUGGESTIONS
Let me know if you'd like some other features added to this indicator, such as additional MA's or something else. I can also customize it for a specific application.
DESCRIPTION
This indicator exemplifies the beauty of the sacred Fibonacci sequence.... used by flowers and seashells and the intrepid day trader. Each color in the ribbon represents an MA of a specific FIB lookback period. This naturally makes the ribbon front weighted, giving recent price action greater importance than older price action. The undulating curls of the ribbon allow a trader to see key convergences and divergences. The ribbon often narrows before a major price movement.
The background is lightly colored to indicate when one average of MA's crosses the other average (1+2+3+4+5) crosses (6+7+8+9+10). Like a standard MA cross, but a little more sophisticated.
The most visually pleasing is SMMA-RMA, but the more effective in anticipating the market is EMA and HMA.
USAGE
Visualizing convergence and divergence as the ribbon widens with sudden price movement and narrows during consolidation
Visualizing general trends as the flipping over of the ribbon represents a general trend change
Setting possible entry and exit points through the width and direction of the ribbon
VARIATIONS
You can select many types of MA's, such as SMA,EMA,HMA,VWMA... and a couple of others. The most effective seem to be EMA,HMA, and VWMA
SUGGESTIONS
Let me know if you'd like some other features added to this indicator, such as additional MA's or something else. I can also customize it for a specific application.
Skrip open-source
Dengan semangat TradingView yang sesungguhnya, pembuat skrip ini telah menjadikannya sebagai sumber terbuka, sehingga para trader dapat meninjau dan memverifikasi fungsinya. Salut untuk penulisnya! Meskipun Anda dapat menggunakannya secara gratis, perlu diingat bahwa penerbitan ulang kode ini tunduk pada Tata Tertib kami.
Pernyataan Penyangkalan
Informasi dan publikasi ini tidak dimaksudkan, dan bukan merupakan, saran atau rekomendasi keuangan, investasi, trading, atau jenis lainnya yang diberikan atau didukung oleh TradingView. Baca selengkapnya di Ketentuan Penggunaan.