OPEN-SOURCE SCRIPT
B's Average RSI (5m-1D)
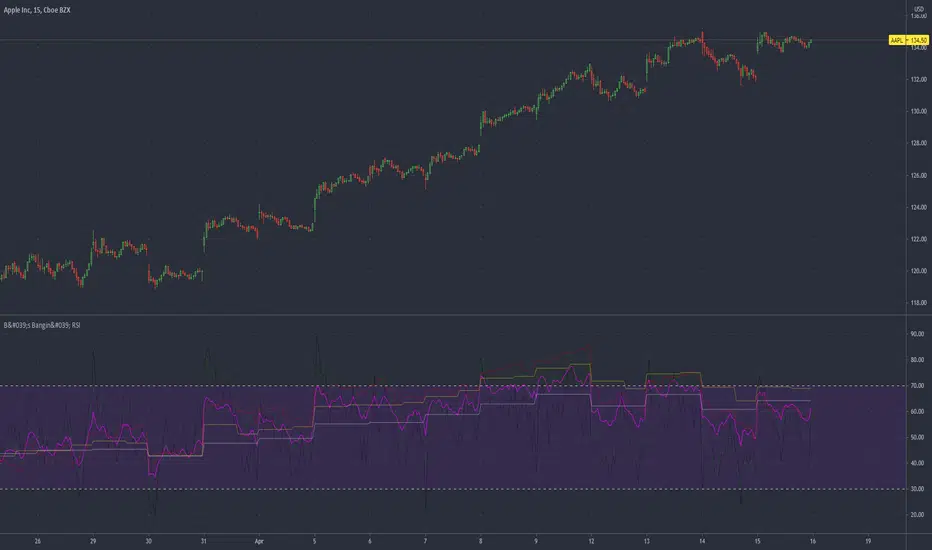
Multiple time frame RSIs plotted onto a single indicator.
Time frames used are:
5m (black)
15m (green)
60m (red)
240m (yellow)
Daily (white)
An average of all of the RSIs (pink)
RSI's are averaged into a single line. Also functions as multiple RSI's.
The pink average line should be used like any other RSI:
Above or below 50 signifies strength and weakness, respectively.
Above 80 and below 20 signal overbought and oversold conditions, respectively.
Skrip open-source
Dengan semangat TradingView yang sesungguhnya, penulis skrip ini telah menjadikannya sumber terbuka, sehingga para trader dapat meninjau dan memverifikasi fungsinya. Hormat untuk penulisnya! Meskipun anda dapat menggunakannya secara gratis, ingatlah bahwa penerbitan ulang kode tersebut tunduk pada Tata Tertib kami.
Pernyataan Penyangkalan
Informasi dan publikasi tidak dimaksudkan untuk menjadi, dan bukan merupakan saran keuangan, investasi, perdagangan, atau rekomendasi lainnya yang diberikan atau didukung oleh TradingView. Baca selengkapnya di Persyaratan Penggunaan.