PROTECTED SOURCE SCRIPT
JackFinance:Vegas Dual Channel
Vegas Tunnel Indicator - Technical Documentation
Overview
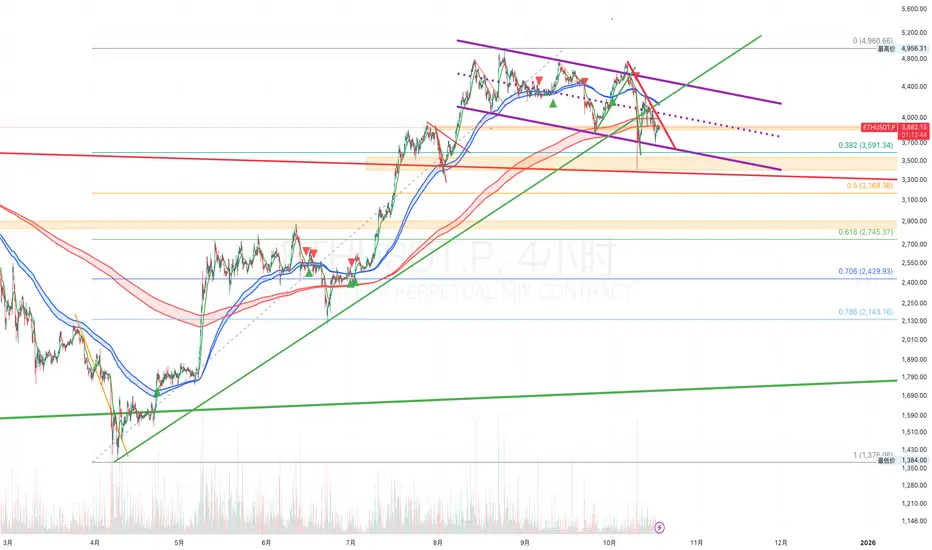
The Vegas Tunnel is a technical analysis indicator utilizing multiple exponential moving averages (EMAs) to identify market trends and potential trading opportunities. The system employs five EMAs organized into three distinct groups for multi-timeframe analysis.
Component Structure
Filter Line: 12-period EMA (green) serving as short-term trend indicator
Channel A: 144-period and 169-period EMAs (blue) defining medium-term trend direction
Channel B: 576-period and 676-period EMAs (red) establishing long-term trend context
Operational Methodology
The indicator generates trading signals based on the relative positioning and interactions between these EMA groups. Price position above both channels indicates bullish market conditions, while position below both channels suggests bearish conditions. Crossovers between the Filter Line and Channel A provide potential entry and exit signals, with Channel B serving as confirmation for major trend direction.
Application Guidelines
This indicator is optimized for swing trading and position trading strategies on timeframes of one hour or higher. Traders should consider the slope and spacing of the channels as indicators of trend strength. The tunnel areas between EMAs function as dynamic support and resistance zones.
Parameter Customization
All EMA periods are adjustable through the input parameters, allowing traders to optimize settings for specific instruments and trading styles. Default values are based on Fibonacci-derived numbers that have demonstrated historical significance in technical analysis.
Overview
The Vegas Tunnel is a technical analysis indicator utilizing multiple exponential moving averages (EMAs) to identify market trends and potential trading opportunities. The system employs five EMAs organized into three distinct groups for multi-timeframe analysis.
Component Structure
Filter Line: 12-period EMA (green) serving as short-term trend indicator
Channel A: 144-period and 169-period EMAs (blue) defining medium-term trend direction
Channel B: 576-period and 676-period EMAs (red) establishing long-term trend context
Operational Methodology
The indicator generates trading signals based on the relative positioning and interactions between these EMA groups. Price position above both channels indicates bullish market conditions, while position below both channels suggests bearish conditions. Crossovers between the Filter Line and Channel A provide potential entry and exit signals, with Channel B serving as confirmation for major trend direction.
Application Guidelines
This indicator is optimized for swing trading and position trading strategies on timeframes of one hour or higher. Traders should consider the slope and spacing of the channels as indicators of trend strength. The tunnel areas between EMAs function as dynamic support and resistance zones.
Parameter Customization
All EMA periods are adjustable through the input parameters, allowing traders to optimize settings for specific instruments and trading styles. Default values are based on Fibonacci-derived numbers that have demonstrated historical significance in technical analysis.
Skrip terproteksi
Skrip ini diterbitkan sebagai sumber tertutup. Namun, Anda dapat menggunakannya dengan bebas dan tanpa batasan apa pun – pelajari lebih lanjut di sini.
Track trend initiation and strictly control trading decisions. Focus on practical analysis of cryptocurrencies and US stocks, transaction review and strategy sharing
TG:t.me/jackfinance888
TG:t.me/jackfinance888
Pernyataan Penyangkalan
Informasi dan publikasi ini tidak dimaksudkan, dan bukan merupakan, saran atau rekomendasi keuangan, investasi, trading, atau jenis lainnya yang diberikan atau didukung oleh TradingView. Baca selengkapnya di Ketentuan Penggunaan.