PROTECTED SOURCE SCRIPT
Bull/Bear Thermometer - GSK-VIZAG-AP-INDIA
Bull/Bear Thermometer - GSK-VIZAG-AP-INDIA
Overview
The Bull/Bear Thermometer is a visual volume-based indicator designed to gauge the cumulative buying (bullish) and selling (bearish) pressure over customization time intervals on any chart. It uses Cumulative Volume Delta (CVD) to track buying and selling dominance and visually represents this data as vertical bar meters with percentage scales.
Key Features
Multi-Time frame Accumulation: Allows users to select accumulation intervals - Daily, Weekly, or Monthly - adapting to their trading style and time frame.
Cumulative Volume Delta (CVD) Computation: Calculates the net buying and selling volume by comparing volume on bullish and bearish bars to measure market strength.
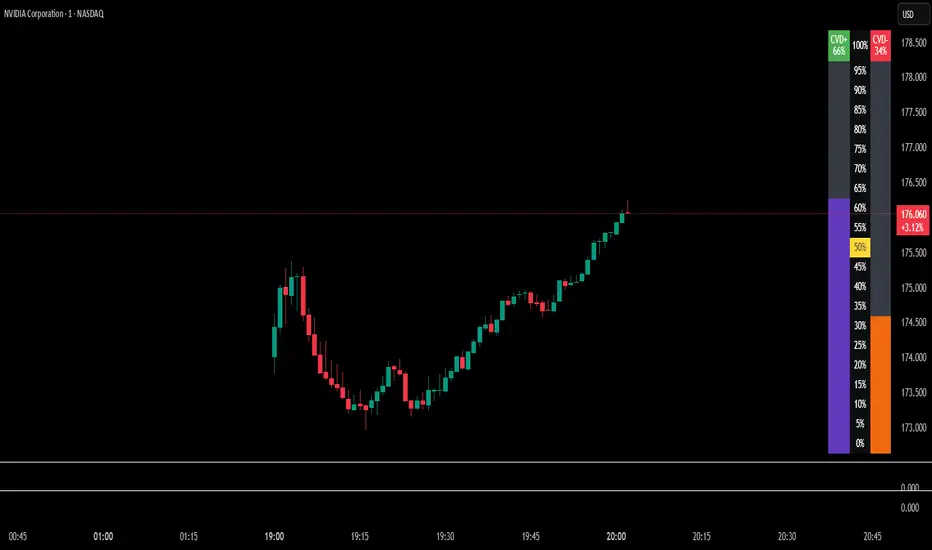
Visual Thermometer Display: Presents buying (CVD+) and selling (CVD-) dominance in colorful vertical bars on an easy-to-read table overlay on the price chart.
Percentage Scale with Highlights: Includes a percentage scale from 0% to 100%, highlighting the important 50% benchmark with a yellow line for quick reference.
Clear Color Coding: Uses green and red color schemes to represent bullish and bearish pressure, with distinctive numeric labels.
Customization Reset Points: Weekly reset day and Monthly reset date options ensure the accumulation aligns with user preference or trading strategy cycles.
Inputs and Usage
Select Time frame: Choose how the buying/selling volume is accumulated — Daily, Weekly (reset day configurable), or Monthly (reset date configurable).
Volume-Based Signals: Monitor changes in buying and selling pressure levels as the market tides shift.
Table Display: A table positioned at the bottom right corner overlays the price chart showing percentage bars for both buying and selling dominance.
Ideal for: Day traders, swing traders, and volume-focused market analysts who want a quick visual summary of market sentiment.
How It Works
The indicator tracks volume on each bar, assigning positive or negative values depending on whether the bar closes higher or lower than the previous.
It accumulates these values over the selected time frame to calculate the cumulative buying (green) and selling (red) volumes.
The data is then converted to percentages and mapped as vertical colored bars in the table.
The midpoint (50%) is highlighted with a yellow line, helping traders quickly assess bullish/bearish balance.
Why Use This Indicator?
Simplicity: Easy to interpret visual thermometer of market sentiment.
Customization: Flexible period settings align with different trading styles.
Volume Insight: Goes beyond price action, factoring volume momentum for deeper market understanding.
Non-intrusive Overlay: Displayed neatly on chart without clutter or distraction.
Recommended Pairings
Use alongside price action or trend indicators.
Suitable for equities, futures, forex, and crypto instruments where volume data is reliable.
Overview
The Bull/Bear Thermometer is a visual volume-based indicator designed to gauge the cumulative buying (bullish) and selling (bearish) pressure over customization time intervals on any chart. It uses Cumulative Volume Delta (CVD) to track buying and selling dominance and visually represents this data as vertical bar meters with percentage scales.
Key Features
Multi-Time frame Accumulation: Allows users to select accumulation intervals - Daily, Weekly, or Monthly - adapting to their trading style and time frame.
Cumulative Volume Delta (CVD) Computation: Calculates the net buying and selling volume by comparing volume on bullish and bearish bars to measure market strength.
Visual Thermometer Display: Presents buying (CVD+) and selling (CVD-) dominance in colorful vertical bars on an easy-to-read table overlay on the price chart.
Percentage Scale with Highlights: Includes a percentage scale from 0% to 100%, highlighting the important 50% benchmark with a yellow line for quick reference.
Clear Color Coding: Uses green and red color schemes to represent bullish and bearish pressure, with distinctive numeric labels.
Customization Reset Points: Weekly reset day and Monthly reset date options ensure the accumulation aligns with user preference or trading strategy cycles.
Inputs and Usage
Select Time frame: Choose how the buying/selling volume is accumulated — Daily, Weekly (reset day configurable), or Monthly (reset date configurable).
Volume-Based Signals: Monitor changes in buying and selling pressure levels as the market tides shift.
Table Display: A table positioned at the bottom right corner overlays the price chart showing percentage bars for both buying and selling dominance.
Ideal for: Day traders, swing traders, and volume-focused market analysts who want a quick visual summary of market sentiment.
How It Works
The indicator tracks volume on each bar, assigning positive or negative values depending on whether the bar closes higher or lower than the previous.
It accumulates these values over the selected time frame to calculate the cumulative buying (green) and selling (red) volumes.
The data is then converted to percentages and mapped as vertical colored bars in the table.
The midpoint (50%) is highlighted with a yellow line, helping traders quickly assess bullish/bearish balance.
Why Use This Indicator?
Simplicity: Easy to interpret visual thermometer of market sentiment.
Customization: Flexible period settings align with different trading styles.
Volume Insight: Goes beyond price action, factoring volume momentum for deeper market understanding.
Non-intrusive Overlay: Displayed neatly on chart without clutter or distraction.
Recommended Pairings
Use alongside price action or trend indicators.
Suitable for equities, futures, forex, and crypto instruments where volume data is reliable.
Skrip terproteksi
Skrip ini diterbitkan sebagai sumber tertutup. Namun, Anda dapat menggunakannya dengan bebas dan tanpa batasan apa pun – pelajari lebih lanjut di sini.
"Created by GSK-VIZAG-AP-INDIA"
Pernyataan Penyangkalan
Informasi dan publikasi ini tidak dimaksudkan, dan bukan merupakan, saran atau rekomendasi keuangan, investasi, trading, atau jenis lainnya yang diberikan atau didukung oleh TradingView. Baca selengkapnya di Ketentuan Penggunaan.