OPEN-SOURCE SCRIPT
Diupdate Cardwell RSI by TQ

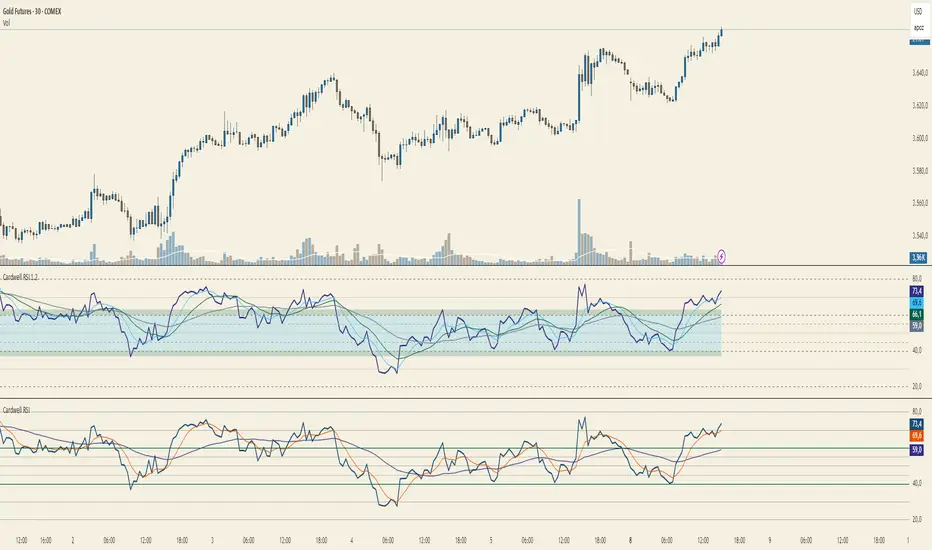
📌 Cardwell RSI – Enhanced Relative Strength Index
This indicator is based on Andrew Cardwell’s RSI methodology, extending the classic RSI with tools to better identify bullish/bearish ranges and trend dynamics.
Key Features:
How to Use:
Default Settings:
This indicator is based on Andrew Cardwell’s RSI methodology, extending the classic RSI with tools to better identify bullish/bearish ranges and trend dynamics.
In uptrends, RSI tends to hold between 40–80 (Cardwell bullish range).
In downtrends, RSI tends to stay between 20–60 (Cardwell bearish range).
Key Features:
- Standard RSI with configurable length & source
- Fast (9) & Slow (45) RSI Moving Averages (toggleable)
- Cardwell Core Levels (80 / 60 / 40 / 20) – enabled by default
- Base Bands (70 / 50 / 30) in dotted style
- Optional custom levels (up to 3)
- Alerts for MA crosses and level crosses
- Data Window metrics: RSI vs Fast/Slow MA differences
How to Use:
- Monitor RSI behavior inside Cardwell’s bullish (40–80) and bearish (20–60) ranges
- Watch RSI crossovers with Fast (9) and Slow (45) MAs to confirm momentum or trend shifts
[\*] Use levels and alerts as confluence with your trading strategy
Default Settings:
- RSI Length: 14
- MA Type: WMA
- Fast MA: 9 (hidden by default)
- Slow MA: 45 (hidden by default)
- Cardwell Levels (80/60/40/20): ON
- Base Bands (70/50/30): ON
Catatan Rilis
Changelog – Cardwell RSI → Cardwell RSI 1.2
1) Plot & Display
- RSI Line: remains, now in consistent color (#312e81), line width 2.
- Moving Averages: previously 2 (9/45); now 3 MAs:
– Fast (9), Custom (user-defined, default 20), Slow (45).
– All shown as lines (width 1).
– Default ON (showMAs = true instead of false). - Before: Fast MA was circles (style_circles).
Now: All MAs are uniform line style for clarity.
2) Levels & Bands
- Core Levels: 80 / 60 / 40 / 20 remain – colors adjusted for visibility on light backgrounds.
- New Mid Levels 55/45: highlight transition/confirmation zones.
- Legacy Bands 70/50/30: still optional (dotted), now darker for better contrast.
- Before: Up to 3 user-defined Custom Levels (C1/C2/C3).
Now: Removed → focus on Cardwell’s ranges & key mid-levels.
3) Regime Zones (new)
- Core Zone 60–40: highlighted with fill (light blue #38bdf8, ~20% visible).
- Throw Zones: above 60→63 and below 40→37 (dark green #065f46, ~20% visible).
- Purpose: Prevent misreading short spikes as regime shifts (Cardwell logic).
4) Colors & Readability
- Palette adapted for light background (#f5f0e1).
- Core levels = taupe shades, mid/legacy bands = darker taupe.
- MA colors unified: Fast = light blue, Custom = green, Slow = slate → quick visual separation.
5) Style Panel & Organization
- Cleaned-up titles: “Main RSI”, “MAs Fast/Custom/Slow”, “Level 80/60/…” etc.
- Helper plots for fills still technically required, but hidden (no titles) & placed at the bottom → less clutter in Style tab.
7) Data Window
- Deltas (RSI − Fast/Custom/Slow) still shown only in Data Window – not plotted.
Why these changes? (Purpose)
- Cardwell Logic made visible: 60/40 shown as zones instead of just lines; throw-bands filter false regime shifts.
- Better trend context: 55/45 mid-levels act as “rails” to assess transitions & confirmations.
- Three MAs = structure: Fast (timing), Custom (flexible filter), Slow (regime).
- MAs default ON: users immediately see rhythm/context.
- Clearer visuals: Lines instead of circles, subtle fills, readable colors → less visual noise, fewer false reads.
Migration – What changes for users?
- Custom levels C1/C2/C3: removed → replace with built-in 55/45 mid-levels if needed.
- Fast MA circles: gone; all MAs are line-style for clarity.
- MAs visible by default: those who prefer a “naked RSI” can toggle off.
- New fills: Core Zone + Throw Zones are ON by default. Can be turned off via showThrow or showBase.
Skrip open-source
Dengan semangat TradingView yang sesungguhnya, pembuat skrip ini telah menjadikannya sebagai sumber terbuka, sehingga para trader dapat meninjau dan memverifikasi fungsinya. Salut untuk penulisnya! Meskipun Anda dapat menggunakannya secara gratis, perlu diingat bahwa penerbitan ulang kode ini tunduk pada Tata Tertib kami.
Pernyataan Penyangkalan
Informasi dan publikasi ini tidak dimaksudkan, dan bukan merupakan, saran atau rekomendasi keuangan, investasi, trading, atau jenis lainnya yang diberikan atau didukung oleh TradingView. Baca selengkapnya di Ketentuan Penggunaan.