OPEN-SOURCE SCRIPT
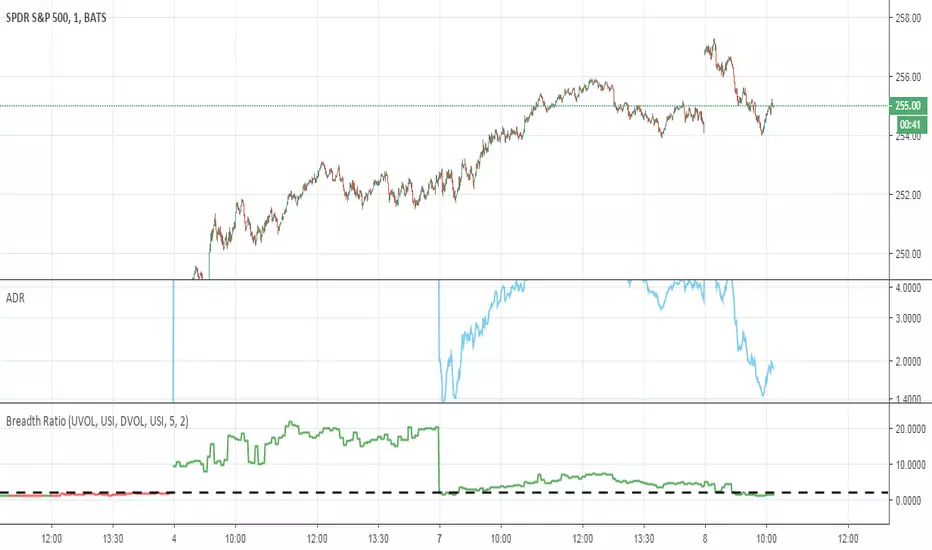
Advance Decline Vol Breadth Ratio - Satinder

This is ratio of aggregated volume of number of advances to the aggregated volume of number of declines. For e.g if Advance Decline ratio is 1, which means 50% of the stocks are advancing and 50% are declining, but there is more volume flowing into the advancing stocks, the market will move up. This ratio helps you gauge the market direction and can be used in combination of other breadth indicators.
--------------
The Breadth Ratio is a volume ratio composed of volume flowing into up stocks versus volume flowing into down stocks. This gives me a ratio that helps me gauge how strong the market will move in a particular direction for that particular day.
- For a STRONG POSITIVE trending day, I would want to see this ratio at a value of at least 2:1 positive; This means that we have 2x the amount of volume flowing into names moving higher on the session when compared to volume going into names moving lower.
-The opposite is true for a weak session moving lower; In that case, I would want to see at least 2:1 negative,This means that 2x the amount of volume is flowing into names moving lower on the session when compared to volume going into names moving higher.
Courtesy RobertTrader
Skrip open-source
Dengan semangat TradingView yang sesungguhnya, pembuat skrip ini telah menjadikannya sebagai sumber terbuka, sehingga para trader dapat meninjau dan memverifikasi fungsinya. Salut untuk penulisnya! Meskipun Anda dapat menggunakannya secara gratis, perlu diingat bahwa penerbitan ulang kode ini tunduk pada Tata Tertib kami.
Pernyataan Penyangkalan
Informasi dan publikasi ini tidak dimaksudkan, dan bukan merupakan, saran atau rekomendasi keuangan, investasi, trading, atau jenis lainnya yang diberikan atau didukung oleh TradingView. Baca selengkapnya di Ketentuan Penggunaan.