OPEN-SOURCE SCRIPT
Ultra Strong Key Levels
Ultra Strong Key Levels (Volume-Highlighted, Scalable)
This indicator automatically detects very strong support and resistance levels using high-strength pivots combined with clustered volume analysis.
It highlights only the most meaningful levels — those backed by significant volume activity — and visually scales each level based on its importance.
How It Works
Identifies strong pivot highs and lows using a customizable pivot strength.
Calculates clustered volume around each pivot to determine how important that level is.
Filters out weak levels by requiring volume around the pivot to exceed a dynamic threshold.
Draws each valid level with:
Adaptive line width (higher volume = thicker line)
Dynamic color intensity (higher volume = brighter line)
Keeps the chart clean by storing only the 10 most recent strong highs and lows.
Inputs
Pivot Strength — Defines how strong a pivot must be to qualify. Larger values = fewer but more reliable levels.
Volume Multiplier — Adjusts sensitivity to volume around the pivot.
Volume Window — Number of bars before and after the pivot used to calculate cluster volume.
Max Line Width — Upper limit for level thickness.
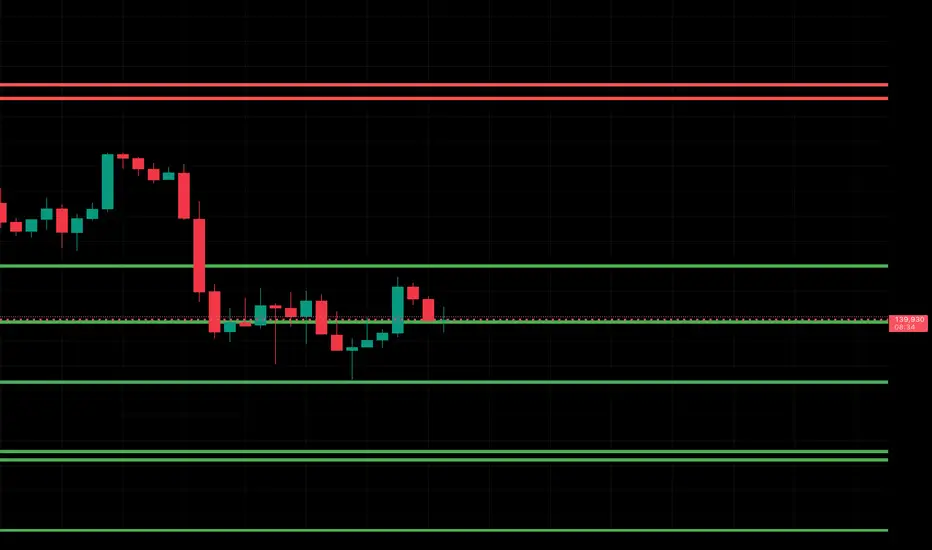
What This Indicator Shows
Red levels = Strong resistance zones (pivot highs with heavy volume)
Green levels = Strong support zones (pivot lows with heavy volume)
Thicker and more intense lines represent higher trading activity, meaning the level is more likely to impact price behavior.
Use Cases
Spot high-value reversal zones
Identify institutional reaction levels
Confirm key breakout/ breakdown points
Combine with trend tools or volume profile for enhanced precision
If you'd like, I can also create:
✓ A shorter version
✓ SEO-optimized TradingView description
✓ A version formatted with bullets, emojis, or markdown style
This indicator automatically detects very strong support and resistance levels using high-strength pivots combined with clustered volume analysis.
It highlights only the most meaningful levels — those backed by significant volume activity — and visually scales each level based on its importance.
How It Works
Identifies strong pivot highs and lows using a customizable pivot strength.
Calculates clustered volume around each pivot to determine how important that level is.
Filters out weak levels by requiring volume around the pivot to exceed a dynamic threshold.
Draws each valid level with:
Adaptive line width (higher volume = thicker line)
Dynamic color intensity (higher volume = brighter line)
Keeps the chart clean by storing only the 10 most recent strong highs and lows.
Inputs
Pivot Strength — Defines how strong a pivot must be to qualify. Larger values = fewer but more reliable levels.
Volume Multiplier — Adjusts sensitivity to volume around the pivot.
Volume Window — Number of bars before and after the pivot used to calculate cluster volume.
Max Line Width — Upper limit for level thickness.
What This Indicator Shows
Red levels = Strong resistance zones (pivot highs with heavy volume)
Green levels = Strong support zones (pivot lows with heavy volume)
Thicker and more intense lines represent higher trading activity, meaning the level is more likely to impact price behavior.
Use Cases
Spot high-value reversal zones
Identify institutional reaction levels
Confirm key breakout/ breakdown points
Combine with trend tools or volume profile for enhanced precision
If you'd like, I can also create:
✓ A shorter version
✓ SEO-optimized TradingView description
✓ A version formatted with bullets, emojis, or markdown style
Skrip open-source
In true TradingView spirit, the creator of this script has made it open-source, so that traders can review and verify its functionality. Kudos to the author! While you can use it for free, remember that republishing the code is subject to our House Rules.
Pernyataan Penyangkalan
The information and publications are not meant to be, and do not constitute, financial, investment, trading, or other types of advice or recommendations supplied or endorsed by TradingView. Read more in the Terms of Use.