OPEN-SOURCE SCRIPT
Correlation Oscillator - Anomaly Alerts
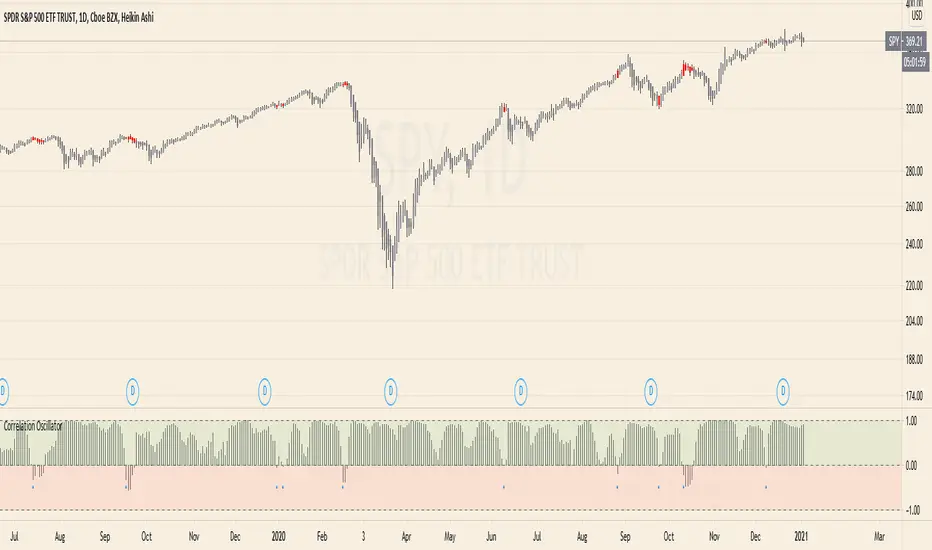
This script plots the correlation for two symbols as an oscillator:
A correlation of 1 means that both values move in the same direction together.
A correlation of -1 means that both values are perfectly negative correlated.
Parameter:
Length of the Correlation
The two symbols you want to calculate the correlation for
Barcolor: Defines whether Bar-coloring is set on.
The Number of bars lookback for anomaly: Say both are normally positively correlated it is an anomaly when the correlation turns negative and vica-versa.
Alerts: You can also set an Alert when an anomaly is detected.(blue dots on oscillator)
This has many use-cases:
For example VVIX and VIX are normally positive correlated.
When this turns negative, this can mean that we are on a turning point:
--> VVIX is rising while VIX is falling, risk of future Volatility is increasing (Top)
--> VIX is rising while VVIX is falling, risk of future Volatility is decreasing (Bottom)
Another use-case is just checking the correlation of stocks in your portfolio to diversify.
Skrip open-source
Dengan semangat TradingView yang sesungguhnya, pembuat skrip ini telah menjadikannya sebagai sumber terbuka, sehingga para trader dapat meninjau dan memverifikasi fungsinya. Salut untuk penulisnya! Meskipun Anda dapat menggunakannya secara gratis, perlu diingat bahwa penerbitan ulang kode ini tunduk pada Tata Tertib kami.
Pernyataan Penyangkalan
Informasi dan publikasi ini tidak dimaksudkan, dan bukan merupakan, saran atau rekomendasi keuangan, investasi, trading, atau jenis lainnya yang diberikan atau didukung oleh TradingView. Baca selengkapnya di Ketentuan Penggunaan.