OPEN-SOURCE SCRIPT
Diupdate Candle Scale Comparison
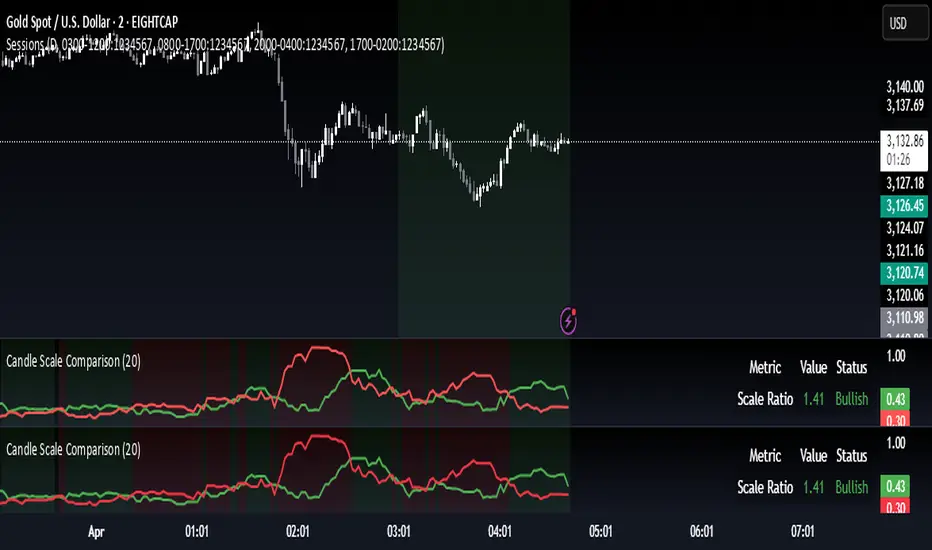
Compares the scale of bullish and bearish candles and shows which side is currently dominant. Works in any symbol.
1. Input Parameters:
- LookbackPeriod: Allows you to set how many bars to look back for calculating averages (default: 20)
- showLabels: Toggle to show/hide dominance labels on the chart
2. Calculations:
- Calculates the scale of bullish candles (close - open)
Calculates the scale of bearish candles (open - close)
- Computes moving averages for both scales using the specified lookback period
- Determines which type of candles are dominating based on the averages
3. Visual Elements:
- Plots two lines showing the average scales:
- Green line for bullish candle scales
- Red line for bearish candle scales
- Adds a background color that changes based on dominance:
- Light green when bullish candles dominate
- Light red when bearish candles dominate
- Shows labels above the chart indicating current dominance
- Displays a table in the top-right corner showing:
- The current scale ratio (bullish/bearish)
- The current dominance status
4. Features:
- The indicator is plotted in a separate pane below the main chart
- Uses color coding for easy visual interpretation
- Provides both visual and numerical representation of the dominance
- Updates in real-time as new candles form
Catatan Rilis
Compares the scale of bullish and bearish candles and shows which side is currently dominant. Works in any symbol.1. Input Parameters:
- LookbackPeriod: Allows you to set how many bars to look back for calculating averages (default: 20)
- showLabels: Toggle to show/hide dominance labels on the chart
2. Calculations:
- Calculates the scale of bullish candles (close - open)
Calculates the scale of bearish candles (open - close)
- Computes moving averages for both scales using the specified lookback period
- Determines which type of candles are dominating based on the averages
3. Visual Elements:
- Plots two lines showing the average scales:
- Green line for bullish candle scales
- Red line for bearish candle scales
- Adds a background color that changes based on dominance:
- Light green when bullish candles dominate
- Light red when bearish candles dominate
- Shows labels above the chart indicating current dominance
- Displays a table in the top-right corner showing:
- The current scale ratio (bullish/bearish)
- The current dominance status
4. Features:
- The indicator is plotted in a separate pane below the main chart
- Uses color coding for easy visual interpretation
- Provides both visual and numerical representation of the dominance
- Updates in real-time as new candles form
Skrip open-source
Dengan semangat TradingView yang sesungguhnya, pembuat skrip ini telah menjadikannya sebagai sumber terbuka, sehingga para trader dapat meninjau dan memverifikasi fungsinya. Salut untuk penulisnya! Meskipun Anda dapat menggunakannya secara gratis, perlu diingat bahwa penerbitan ulang kode ini tunduk pada Tata Tertib kami.
Pernyataan Penyangkalan
Informasi dan publikasi ini tidak dimaksudkan, dan bukan merupakan, saran atau rekomendasi keuangan, investasi, trading, atau jenis lainnya yang diberikan atau didukung oleh TradingView. Baca selengkapnya di Ketentuan Penggunaan.