OPEN-SOURCE SCRIPT
Diupdate Adaptive Fisherized ROC

Introduction
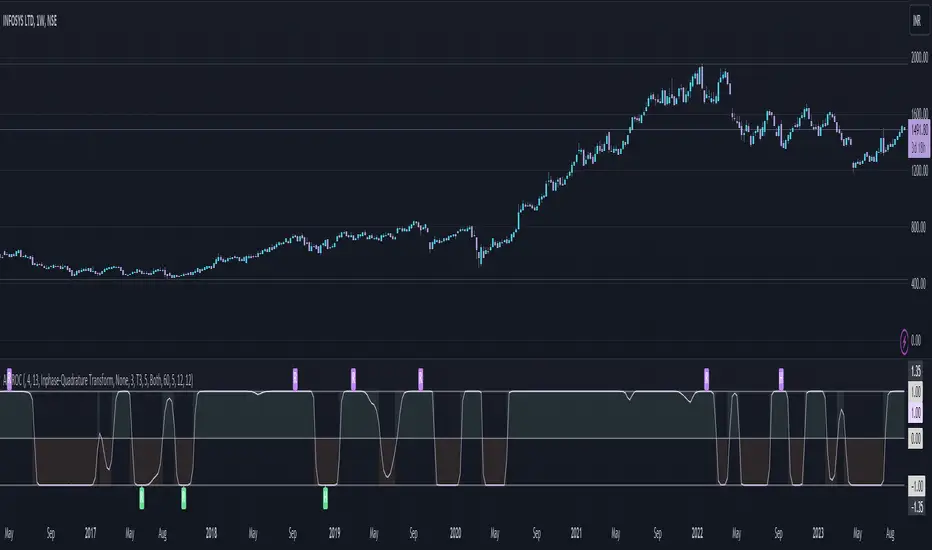
Hello community, here I applied the Inverse Fisher Transform, Ehlers dominant cycle determination and smoothing methods on a simple Rate of Change (ROC) indicator
You have a lot of options to adjust the indicator.
Usage
The rate of change is most often used to measure the change in a security's price over time.
That's why it is a momentum indicator.
When it is positive, prices are accelerating upward; when negative, downward.
It is useable on every timeframe and could be a potential filter for you your trading system.
IMO it could help you to confirm entries or find exits (e.g. you have a long open, roc goes negative, you exit).
If you use a trend-following strategy, you could maybe look out for red zones in an in uptrend or green zones in a downtrend to confirm your entry on a pullback.
Signals
ROC above 0 => confirms bullish trend
ROC below 0 => confirms bearish trend
ROC hovers near 0 => price is consolidating
Enjoy! 🚀
Catatan Rilis
Updated default valuesFixed hilber transform calculation bug
Catatan Rilis
Updated default valuesAdded min length check
Fixed Inphase-Quadrature Transform calculation
Fixed adaptive mode selection bug
Catatan Rilis
Decreased lag of Hann Window smoothing by applying it to the price instead of the indicator itself.Increased linewidth and decreased transparency on background colors
Catatan Rilis
Updated plotCatatan Rilis
Just to update the chartCatatan Rilis
- Added divergence detection
- Removed wrong Kalman filter
- Reworked smoothing system -> Now you can apply the smoothing methods on the source price (which is close[1]) or on the indicator itself depending on what your goal is with the smoothing.
Catatan Rilis
Applied the IFT after the smoothing to stick to the scale of -1 to 1Catatan Rilis
Removed 34 as max length of Homodyne DiscriminatorCatatan Rilis
Fixed that T3 Normal wasn't selectale.Skrip open-source
Dengan semangat TradingView yang sesungguhnya, pembuat skrip ini telah menjadikannya sebagai sumber terbuka, sehingga para trader dapat meninjau dan memverifikasi fungsinya. Salut untuk penulisnya! Meskipun Anda dapat menggunakannya secara gratis, perlu diingat bahwa penerbitan ulang kode ini tunduk pada Tata Tertib kami.
Pernyataan Penyangkalan
Informasi dan publikasi ini tidak dimaksudkan, dan bukan merupakan, saran atau rekomendasi keuangan, investasi, trading, atau jenis lainnya yang diberikan atau didukung oleh TradingView. Baca selengkapnya di Ketentuan Penggunaan.
Skrip open-source
Dengan semangat TradingView yang sesungguhnya, pembuat skrip ini telah menjadikannya sebagai sumber terbuka, sehingga para trader dapat meninjau dan memverifikasi fungsinya. Salut untuk penulisnya! Meskipun Anda dapat menggunakannya secara gratis, perlu diingat bahwa penerbitan ulang kode ini tunduk pada Tata Tertib kami.
Pernyataan Penyangkalan
Informasi dan publikasi ini tidak dimaksudkan, dan bukan merupakan, saran atau rekomendasi keuangan, investasi, trading, atau jenis lainnya yang diberikan atau didukung oleh TradingView. Baca selengkapnya di Ketentuan Penggunaan.