OPEN-SOURCE SCRIPT
Power Zone Trader (PZT)
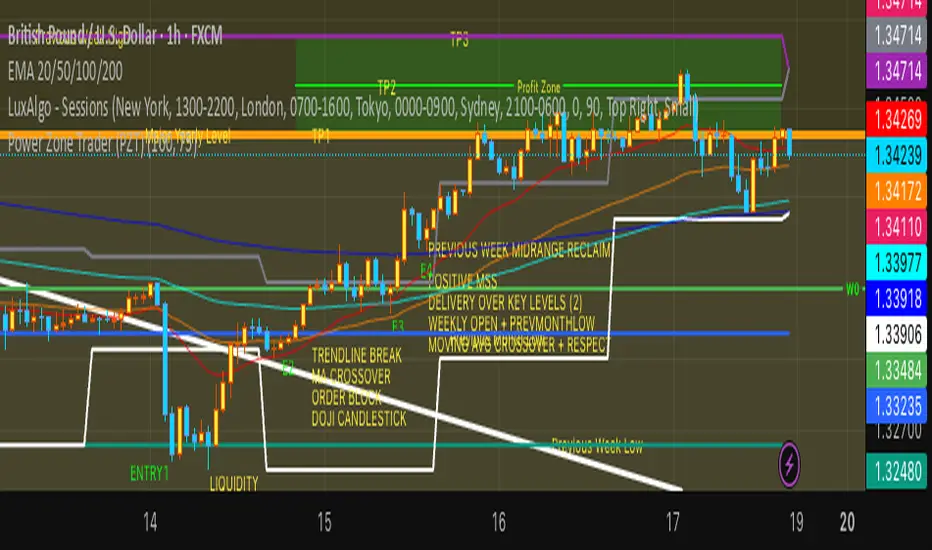
The PZT Indicator (Power Zone Trader ) is a multi-timeframe confluence system designed to identify and visualize natural support and resistance levels with exceptional clarity. By automatically mapping key structural highs and lows from higher timeframes, PZT allows traders to see where price is most likely to react, reverse, or accelerate, forming the foundation for high-probability trade setups. PZT highlights key reaction zones that influence order flow and trader behavior across all markets — including Forex, Crypto, Indices, and Commodities.
📍 Indicator Key
Each color represents a significant price level derived from its respective timeframe, helping traders instantly gauge market context and potential liquidity pools:
Color Level Represented Significance
🔴 Red Yearly High Strong resistance — potential selling pressure and major liquidity sweep zones.
🟢 Green Yearly Low Strong support — potential buying interest and accumulation points.
🟠 Orange Monthly High Intermediate resistance — swing rejection or continuation decision zone.
🔵 Blue Monthly Low Intermediate support — potential retracement or base-building area.
🟣 Purple Weekly High Short-term resistance — common rejection level or stop hunt zone.
🟤 Teal Weekly Low Short-term support — potential rebound or liquidity grab.
⚫ Gray Daily High Intraday resistance — active scalper and day trader interest.
⚪ White Daily Low Intraday support — short-term bounce or continuation pivot.
Skrip open-source
Dengan semangat TradingView yang sesungguhnya, penulis skrip ini telah menjadikannya sumber terbuka, sehingga para trader dapat meninjau dan memverifikasi fungsinya. Hormat untuk penulisnya! Meskipun anda dapat menggunakannya secara gratis, ingatlah bahwa penerbitan ulang kode tersebut tunduk pada Tata Tertib kami.
Pernyataan Penyangkalan
Informasi dan publikasi tidak dimaksudkan untuk menjadi, dan bukan merupakan saran keuangan, investasi, perdagangan, atau rekomendasi lainnya yang diberikan atau didukung oleh TradingView. Baca selengkapnya di Persyaratan Penggunaan.