PROTECTED SOURCE SCRIPT
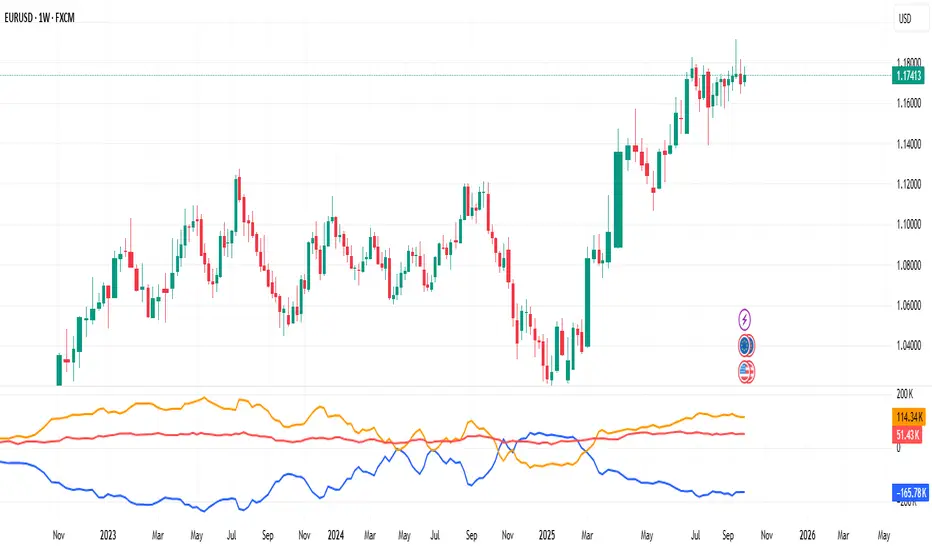
COT Raw Net Positions

📊 What the COT Raw Data Shows — and Why It’s So Valuable
The COT Raw view displays the actual net positions of each trader group (Commercials, Large Speculators, and Retail/Small Traders) as reported weekly by the CFTC.
Instead of normalizing or smoothing the data, it shows the real contract numbers — how many futures contracts each group is long or short.
This raw form of the data offers pure transparency into market positioning.
It allows traders to:
See the true scale of institutional buying or selling pressure.
Understand how different market participants are behaving week to week.
Spot early accumulation or distribution phases long before they become visible on price charts.
Compare multiple assets side by side to gauge relative strength across markets.
While the COT Index simplifies things by showing where current positions sit relative to history, the COT Raw view provides context and depth — helping experienced traders understand why those extremes are forming.
In essence:
📈 COT Raw = the foundation of the data — it shows what’s really happening under the surface.
It’s a must-have for traders who want to study institutional flows, analyze correlations, and confirm macro sentiment shifts directly from the source.
⚠️ Note: As with all COT-based tools, the data updates weekly and is best interpreted on weekly or higher timeframes.
Skrip terproteksi
Skrip ini diterbitkan sebagai sumber tertutup. Namun, anda dapat menggunakannya secara bebas dan tanpa batasan apa pun – pelajari lebih lanjut di sini.
Pernyataan Penyangkalan
Informasi dan publikasi tidak dimaksudkan untuk menjadi, dan bukan merupakan saran keuangan, investasi, perdagangan, atau rekomendasi lainnya yang diberikan atau didukung oleh TradingView. Baca selengkapnya di Persyaratan Penggunaan.