OPEN-SOURCE SCRIPT
Diupdate Wavechart v2
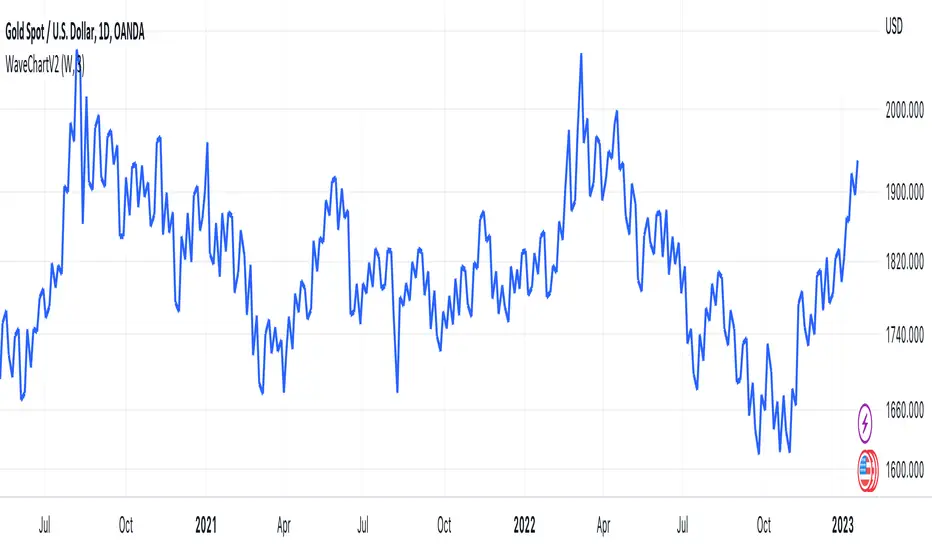
##Wave Chart v2##
For analyzing Neo-wave theory
Plot the market's highs and lows in real-time order.
Then connect the highs and lows
with a diagonal line. Next, the last plot of one day (or bar) is connected with a straight line to the
first plot of the next day (or bar).
For analyzing Neo-wave theory
Plot the market's highs and lows in real-time order.
Then connect the highs and lows
with a diagonal line. Next, the last plot of one day (or bar) is connected with a straight line to the
first plot of the next day (or bar).
Catatan Rilis
Chang nameCatatan Rilis
- Add line width input - Add Force plot on the last bar
Catatan Rilis
Add Timeframe DayCatatan Rilis
In some cases, it may be uncertain whether the high or low value should come first, as both values are derived from the same candlestick. We currently assume it is based on the closing price of the candlestick.
However, there is an option in settings to display an unsure line.
To avoid ambiguity, it is recommended to use multiple timeframes for analysis.
Catatan Rilis
fix Force plot on the last barCatatan Rilis
Add more TimeframeCatatan Rilis
fix period divisionCatatan Rilis
fix bug assume high low time based on closing price of the candlestickCatatan Rilis
Add Timeframe 240,60,30 Catatan Rilis
Add timeframe 2W and 2.5YCatatan Rilis
fix 2.5yearSkrip open-source
Dengan semangat TradingView yang sesungguhnya, pembuat skrip ini telah menjadikannya sebagai sumber terbuka, sehingga para trader dapat meninjau dan memverifikasi fungsinya. Salut untuk penulisnya! Meskipun Anda dapat menggunakannya secara gratis, perlu diingat bahwa penerbitan ulang kode ini tunduk pada Tata Tertib kami.
Pernyataan Penyangkalan
Informasi dan publikasi ini tidak dimaksudkan, dan bukan merupakan, saran atau rekomendasi keuangan, investasi, trading, atau jenis lainnya yang diberikan atau didukung oleh TradingView. Baca selengkapnya di Ketentuan Penggunaan.
Skrip open-source
Dengan semangat TradingView yang sesungguhnya, pembuat skrip ini telah menjadikannya sebagai sumber terbuka, sehingga para trader dapat meninjau dan memverifikasi fungsinya. Salut untuk penulisnya! Meskipun Anda dapat menggunakannya secara gratis, perlu diingat bahwa penerbitan ulang kode ini tunduk pada Tata Tertib kami.
Pernyataan Penyangkalan
Informasi dan publikasi ini tidak dimaksudkan, dan bukan merupakan, saran atau rekomendasi keuangan, investasi, trading, atau jenis lainnya yang diberikan atau didukung oleh TradingView. Baca selengkapnya di Ketentuan Penggunaan.