OPEN-SOURCE SCRIPT
VWAP oscillator [upslidedown]
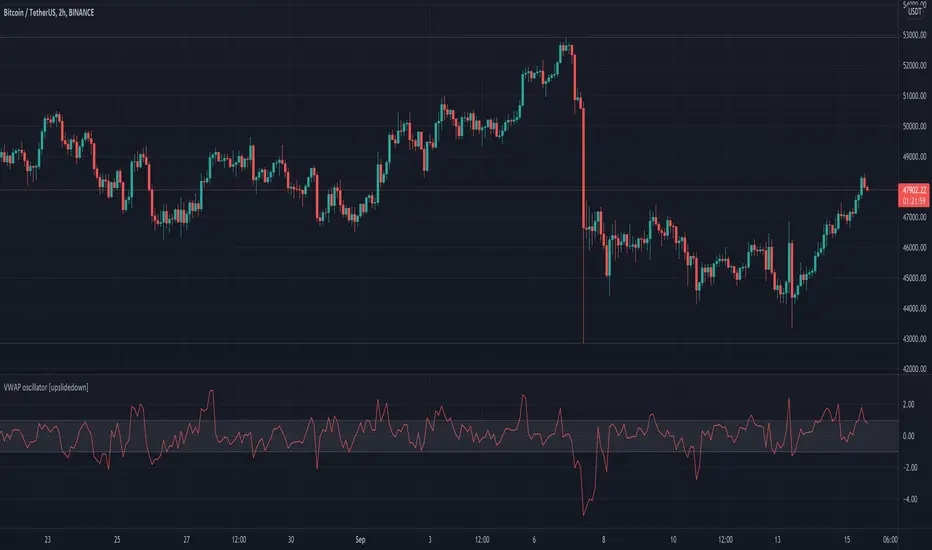
This VWAP oscillator showcases the percent difference between VWAP and current price within an oscillator centered on 0. My thesis for this indicator is that trend following within the threshold zone (defaulted to 1%) would be "choppy" but outside is a significant trend. Another way to think about VWAP is potential for taking profits, as price will always be magnetized back to the center.
I find this sort of visualization very helpful when creating strategies that revolve around a filter such as VWAP and wasn't able to find anything that was close and/or provided this sort of visualization publicly. Enjoy and let me know if you find this useful or can dream up an improvement.
I find this sort of visualization very helpful when creating strategies that revolve around a filter such as VWAP and wasn't able to find anything that was close and/or provided this sort of visualization publicly. Enjoy and let me know if you find this useful or can dream up an improvement.
Skrip open-source
Dengan semangat TradingView yang sesungguhnya, pembuat skrip ini telah menjadikannya sebagai sumber terbuka, sehingga para trader dapat meninjau dan memverifikasi fungsinya. Salut untuk penulisnya! Meskipun Anda dapat menggunakannya secara gratis, perlu diingat bahwa penerbitan ulang kode ini tunduk pada Tata Tertib kami.
❤️ Premium indicator subscription @ Whop includes: Mojo Levels, Manipulation Model, Super Oscillator, VIX Meter, and Volatility Radar
🔗 whop.com/c/upslidedown/t use discount code FRIENDOFUSD for 20% off FOREVER
🔗 whop.com/c/upslidedown/t use discount code FRIENDOFUSD for 20% off FOREVER
Pernyataan Penyangkalan
Informasi dan publikasi ini tidak dimaksudkan, dan bukan merupakan, saran atau rekomendasi keuangan, investasi, trading, atau jenis lainnya yang diberikan atau didukung oleh TradingView. Baca selengkapnya di Ketentuan Penggunaan.