PROTECTED SOURCE SCRIPT
Pulse Lite [BreakoutOrFakeout]
Pulse Lite [BreakoutOrFakeout] - FREE
What It Does
A simplified momentum indicator that shows you the market's "pulse" through a smooth, easy-to-read line. Perfect for traders who want clean, reliable momentum signals without the complexity.
Key Features
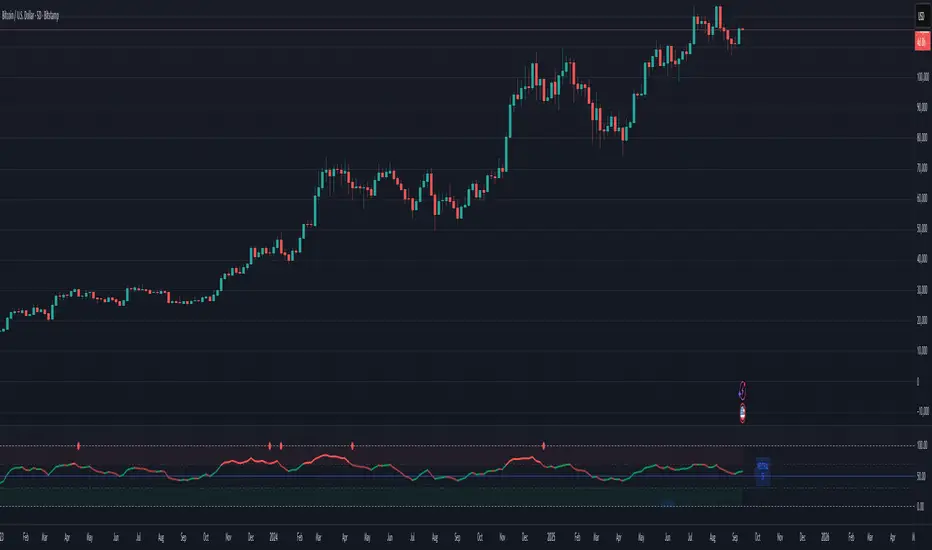
💗 Smooth Pulse Line
Clean momentum reading from 0-100
Dynamic colors show market state instantly
No choppy signals or false noise
📊 3-Zone System
Above 70 = Overbought (red zone)
30-70 = Neutral (clear zone)
Below 30 = Oversold (green zone)
🎯 Simple Signals
Green dots when leaving oversold
Red dots when leaving overbought
Color changes show momentum shifts
📍 Current Reading
Live status: HIGH, NEUTRAL, or LOW
Exact value display
Color-coded label
How to Use
Basic Strategy
Oversold (below 30): Look for green dot, consider longs
Overbought (above 70): Look for red dot, consider shorts
Neutral (30-70): Follow the color for trend direction
Quick Rules
Green pulse = Bullish momentum
Red pulse = Bearish momentum
Blue pulse = Neutral/transitioning
Visual Guide
🔴 Red Zone (70-100) = Overbought, reversal risk
🟢 Green Zone (0-30) = Oversold, bounce likely
🔵 Blue Line (50) = Momentum midpoint
Why Start with Lite?
This free version gives you the core pulse reading system - clean, simple, and effective. Perfect for learning the concept or if you prefer minimalist indicators. No clutter, no complexity, just the essential momentum pulse.
Want More Power?
Upgrade to Pulse Meter PRO for:
5-zone power system for precision entries
Signal line with crossover alerts
Histogram strength visualization
Divergence detection
Multi-timeframe dashboard
Advanced filtering algorithms
Priority support
Best For
Beginners learning momentum trading
Traders who prefer simple, clean indicators
Quick momentum checks
Basic overbought/oversold signals
⚠️ DISCLAIMER: For educational purposes only. Trading involves substantial risk of loss. Past performance does not guarantee future results. Always use proper risk management.
What It Does
A simplified momentum indicator that shows you the market's "pulse" through a smooth, easy-to-read line. Perfect for traders who want clean, reliable momentum signals without the complexity.
Key Features
💗 Smooth Pulse Line
Clean momentum reading from 0-100
Dynamic colors show market state instantly
No choppy signals or false noise
📊 3-Zone System
Above 70 = Overbought (red zone)
30-70 = Neutral (clear zone)
Below 30 = Oversold (green zone)
🎯 Simple Signals
Green dots when leaving oversold
Red dots when leaving overbought
Color changes show momentum shifts
📍 Current Reading
Live status: HIGH, NEUTRAL, or LOW
Exact value display
Color-coded label
How to Use
Basic Strategy
Oversold (below 30): Look for green dot, consider longs
Overbought (above 70): Look for red dot, consider shorts
Neutral (30-70): Follow the color for trend direction
Quick Rules
Green pulse = Bullish momentum
Red pulse = Bearish momentum
Blue pulse = Neutral/transitioning
Visual Guide
🔴 Red Zone (70-100) = Overbought, reversal risk
🟢 Green Zone (0-30) = Oversold, bounce likely
🔵 Blue Line (50) = Momentum midpoint
Why Start with Lite?
This free version gives you the core pulse reading system - clean, simple, and effective. Perfect for learning the concept or if you prefer minimalist indicators. No clutter, no complexity, just the essential momentum pulse.
Want More Power?
Upgrade to Pulse Meter PRO for:
5-zone power system for precision entries
Signal line with crossover alerts
Histogram strength visualization
Divergence detection
Multi-timeframe dashboard
Advanced filtering algorithms
Priority support
Best For
Beginners learning momentum trading
Traders who prefer simple, clean indicators
Quick momentum checks
Basic overbought/oversold signals
⚠️ DISCLAIMER: For educational purposes only. Trading involves substantial risk of loss. Past performance does not guarantee future results. Always use proper risk management.
Skrip terproteksi
Skrip ini diterbitkan sebagai sumber tertutup. Namun, Anda dapat menggunakannya dengan bebas dan tanpa batasan apa pun – pelajari lebih lanjut di sini.
Pernyataan Penyangkalan
Informasi dan publikasi ini tidak dimaksudkan, dan bukan merupakan, saran atau rekomendasi keuangan, investasi, trading, atau jenis lainnya yang diberikan atau didukung oleh TradingView. Baca selengkapnya di Ketentuan Penggunaan.