OPEN-SOURCE SCRIPT
Pivot trend indicator
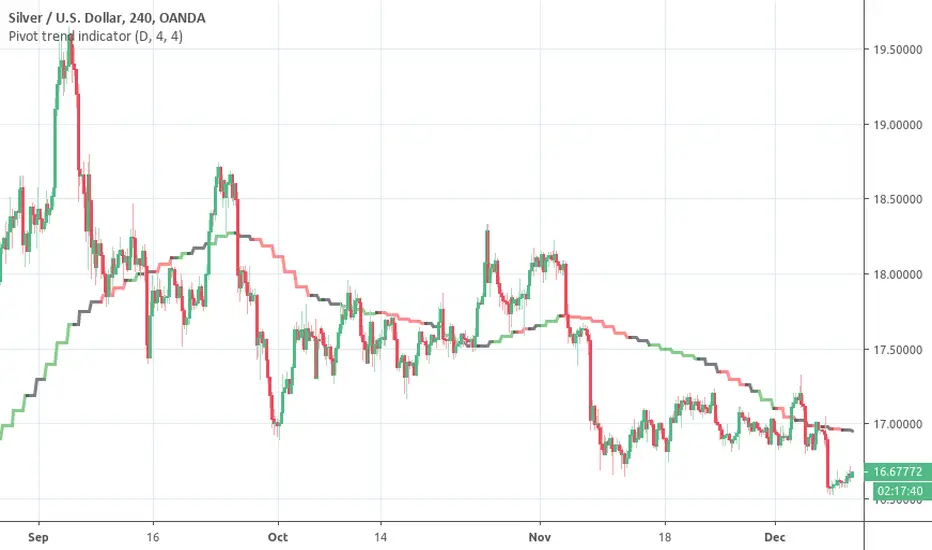
This is a LAGGING indicator which can provide a good indication of trend. It require a certain (configurable) number of candles to have closed before it can determine whether a pivot has formed.
It provides a 20 period SMA for the timeframe of your choice which is color coded to show the trend according to confirmed pivots.
Anticipated usage:
The SMA colors:
Why the 20 SMA?
Feel free to adjust it for your purposes. I personally find that using a higher time frame 20 SMA is a better indication of trend than longer period MAs on shorter time frames. This can be seen from comparing the 20 daily SMA and 200 hourly SMA.
Pivot adjustment
The pivots use the selected time frame (not) the MA trend time frame. You can specify the left and right candles required to confirm a pivot
It provides a 20 period SMA for the timeframe of your choice which is color coded to show the trend according to confirmed pivots.
Anticipated usage:
- Long / Short bias is determined by pivot trend
- Trader seeks entries according to their strategy
- Black consolidation areas may trigger a re-evaluation of the trade and can serve as good profit taking areas
The SMA colors:
- Green -> Higher highs & Higher lows
- Red -> Lower highs & Lowers lows
- Black -> No clear trend from the pivots
Why the 20 SMA?
Feel free to adjust it for your purposes. I personally find that using a higher time frame 20 SMA is a better indication of trend than longer period MAs on shorter time frames. This can be seen from comparing the 20 daily SMA and 200 hourly SMA.
Pivot adjustment
The pivots use the selected time frame (not) the MA trend time frame. You can specify the left and right candles required to confirm a pivot
Skrip open-source
Dengan semangat TradingView yang sesungguhnya, pembuat skrip ini telah menjadikannya sebagai sumber terbuka, sehingga para trader dapat meninjau dan memverifikasi fungsinya. Salut untuk penulisnya! Meskipun Anda dapat menggunakannya secara gratis, perlu diingat bahwa penerbitan ulang kode ini tunduk pada Tata Tertib kami.
Pernyataan Penyangkalan
Informasi dan publikasi ini tidak dimaksudkan, dan bukan merupakan, saran atau rekomendasi keuangan, investasi, trading, atau jenis lainnya yang diberikan atau didukung oleh TradingView. Baca selengkapnya di Ketentuan Penggunaan.