PROTECTED SOURCE SCRIPT
Diupdate COT INDEX
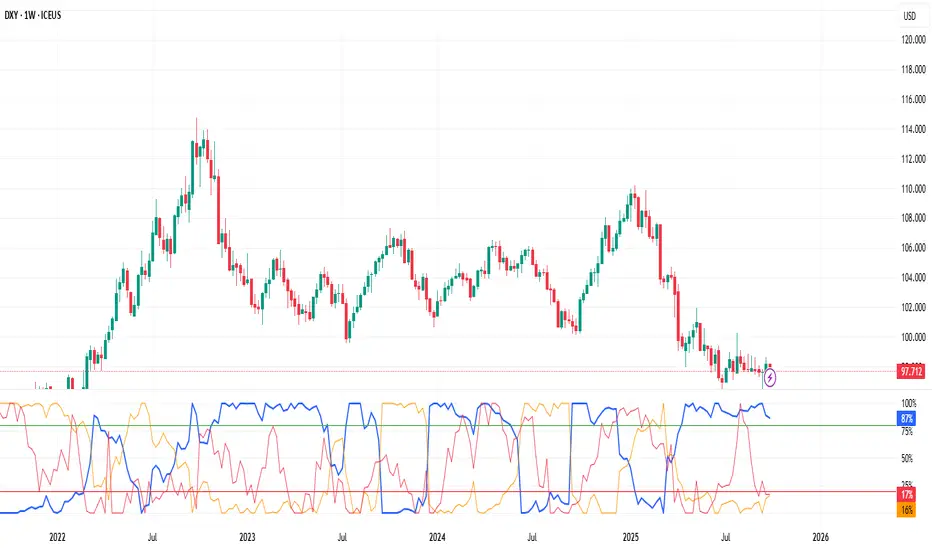
🧠 What the COT (Commitment of Traders) Report Tells Us
The COT report is one of the most powerful tools for understanding what’s happening behind the price.
Published weekly by the CFTC (Commodity Futures Trading Commission), it shows how different groups of market participants — mainly Commercials (hedgers), Large Speculators (funds), and Retail/Small Traders — are positioned in the futures markets.
In simple terms:
Commercials (like producers and large corporations) usually trade against the trend to hedge risk.
Large Speculators (like hedge funds and institutions) often drive the trend.
Retail traders tend to follow late and are often positioned on the wrong side at turning points.
By tracking these positions, traders can spot extreme sentiment levels — moments when big players are heavily long or short. Such extremes often precede major market reversals or trend continuations.
That’s why the COT indicator is so valuable:
It reveals the real market positioning of institutions versus retail.
It helps identify contrarian opportunities when the crowd is overexposed.
It provides a macro-level confirmation for swing or position trades.
⚠️ Note:
Because the COT data is released once per week, this indicator is designed to work only on weekly charts — it’s a long-term sentiment and positioning tool, not a short-term timing signal.
Catatan Rilis
updatedSkrip terproteksi
Skrip ini diterbitkan sebagai sumber tertutup. Namun, anda dapat menggunakannya secara bebas dan tanpa batasan apa pun – pelajari lebih lanjut di sini.
Pernyataan Penyangkalan
Informasi dan publikasi tidak dimaksudkan untuk menjadi, dan bukan merupakan saran keuangan, investasi, perdagangan, atau rekomendasi lainnya yang diberikan atau didukung oleh TradingView. Baca selengkapnya di Persyaratan Penggunaan.
Skrip terproteksi
Skrip ini diterbitkan sebagai sumber tertutup. Namun, anda dapat menggunakannya secara bebas dan tanpa batasan apa pun – pelajari lebih lanjut di sini.
Pernyataan Penyangkalan
Informasi dan publikasi tidak dimaksudkan untuk menjadi, dan bukan merupakan saran keuangan, investasi, perdagangan, atau rekomendasi lainnya yang diberikan atau didukung oleh TradingView. Baca selengkapnya di Persyaratan Penggunaan.