OPEN-SOURCE SCRIPT
MTF Support & Resistance
📌 Multi-Timeframe Support & Resistance (MTF S&R) Indicator
🔎 Overview:
The MTF Support & Resistance Indicator is a powerful tool designed to help traders identify critical price levels where the market is likely to react. This indicator automatically detects support and resistance zones based on a user-defined lookback period and extends these levels dynamically on the chart. Additionally, it provides multi-timeframe (MTF) support and resistance zones, allowing traders to view higher timeframe key levels alongside their current timeframe.
Support and resistance levels are crucial for traders as they help in determining potential reversal points, breakout zones, and trend continuation signals. By incorporating multi-timeframe analysis, this indicator enhances decision-making by providing a broader perspective of price action.
✨ Key Features & Benefits:
✅ Automatic Support & Resistance Detection – No need to manually plot levels; the indicator calculates them dynamically based on historical price action.
✅ Multi-Timeframe (MTF) Levels – Enables traders to see higher timeframe S&R levels on their current chart for better trend confirmation.
✅ Customizable Lookback Period – Adjust sensitivity by modifying the number of historical bars considered when calculating support and resistance.
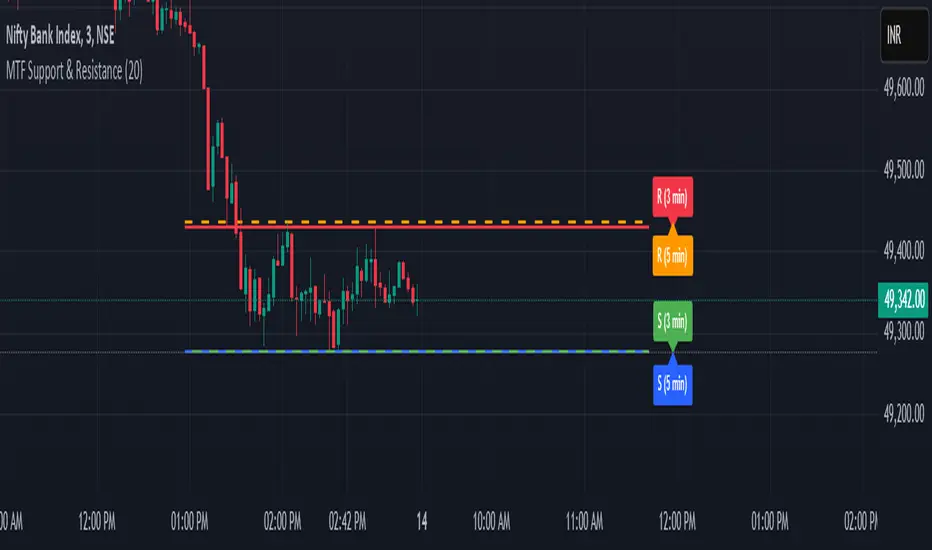
✅ Color-Coded Visualization –
Green Line → Support on the current timeframe
Red Line → Resistance on the current timeframe
Dashed Blue Line → Higher timeframe support
Dashed Orange Line → Higher timeframe resistance
✅ Dynamic Extension of Levels – Levels extend left and right for better visibility across multiple bars.
✅ Real-Time Updates – Automatically refreshes as new price data comes in.
✅ Non-Repainting – Ensures reliable support and resistance levels that do not change after the bar closes.
📈 How to Use the Indicator:
Identify Key Price Levels:
The green line represents support, where price may bounce.
The red line represents resistance, where price may reject.
The blue dashed line represents support on a higher timeframe, making it a stronger level.
The orange dashed line represents higher timeframe resistance, helping identify major breakout zones.
Trend Trading:
Look for price action around these levels to confirm breakouts or reversals.
Combine with trend indicators (like moving averages) to validate trade entries.
Range Trading:
If the price is bouncing between support and resistance, consider range trading strategies (buying at support, selling at resistance).
Breakout Trading:
If the price breaks above resistance, it could indicate a bullish trend continuation.
If the price breaks below support, it could signal a bearish trend continuation.
⚙️ Indicator Settings:
Lookback Period: Determines the number of historical bars used to calculate support and resistance.
Show Higher Timeframe Levels (MTF): Enable/disable MTF support and resistance levels.
Extend Bars: Extends the drawn lines for better visualization.
Support/Resistance Colors: Allows users to customize the appearance of the lines.
⚠️ Important Notes:
This indicator does NOT generate buy/sell signals—it serves as a technical tool to improve trading analysis.
Best Used With Other Indicators: Consider combining it with volume, moving averages, RSI, or price action strategies for more reliable trade setups.
Works on Any Market & Timeframe: Forex, stocks, commodities, indices, and cryptocurrencies.
Use Higher Timeframe Levels for Stronger Confirmations: If a higher timeframe support/resistance level aligns with a lower timeframe level, it may indicate a stronger price reaction.
🎯 Who Should Use This Indicator?
📌 Scalpers & Day Traders – Identify short-term support and resistance levels for quick trades.
📌 Swing Traders – Utilize higher timeframe levels for position entries and exits.
📌 Trend Traders – Confirm breakout zones and key price levels for trend-following strategies.
📌 Reversal Traders – Spot potential reversal zones at significant S&R levels.
🔎 Overview:
The MTF Support & Resistance Indicator is a powerful tool designed to help traders identify critical price levels where the market is likely to react. This indicator automatically detects support and resistance zones based on a user-defined lookback period and extends these levels dynamically on the chart. Additionally, it provides multi-timeframe (MTF) support and resistance zones, allowing traders to view higher timeframe key levels alongside their current timeframe.
Support and resistance levels are crucial for traders as they help in determining potential reversal points, breakout zones, and trend continuation signals. By incorporating multi-timeframe analysis, this indicator enhances decision-making by providing a broader perspective of price action.
✨ Key Features & Benefits:
✅ Automatic Support & Resistance Detection – No need to manually plot levels; the indicator calculates them dynamically based on historical price action.
✅ Multi-Timeframe (MTF) Levels – Enables traders to see higher timeframe S&R levels on their current chart for better trend confirmation.
✅ Customizable Lookback Period – Adjust sensitivity by modifying the number of historical bars considered when calculating support and resistance.
✅ Color-Coded Visualization –
Green Line → Support on the current timeframe
Red Line → Resistance on the current timeframe
Dashed Blue Line → Higher timeframe support
Dashed Orange Line → Higher timeframe resistance
✅ Dynamic Extension of Levels – Levels extend left and right for better visibility across multiple bars.
✅ Real-Time Updates – Automatically refreshes as new price data comes in.
✅ Non-Repainting – Ensures reliable support and resistance levels that do not change after the bar closes.
📈 How to Use the Indicator:
Identify Key Price Levels:
The green line represents support, where price may bounce.
The red line represents resistance, where price may reject.
The blue dashed line represents support on a higher timeframe, making it a stronger level.
The orange dashed line represents higher timeframe resistance, helping identify major breakout zones.
Trend Trading:
Look for price action around these levels to confirm breakouts or reversals.
Combine with trend indicators (like moving averages) to validate trade entries.
Range Trading:
If the price is bouncing between support and resistance, consider range trading strategies (buying at support, selling at resistance).
Breakout Trading:
If the price breaks above resistance, it could indicate a bullish trend continuation.
If the price breaks below support, it could signal a bearish trend continuation.
⚙️ Indicator Settings:
Lookback Period: Determines the number of historical bars used to calculate support and resistance.
Show Higher Timeframe Levels (MTF): Enable/disable MTF support and resistance levels.
Extend Bars: Extends the drawn lines for better visualization.
Support/Resistance Colors: Allows users to customize the appearance of the lines.
⚠️ Important Notes:
This indicator does NOT generate buy/sell signals—it serves as a technical tool to improve trading analysis.
Best Used With Other Indicators: Consider combining it with volume, moving averages, RSI, or price action strategies for more reliable trade setups.
Works on Any Market & Timeframe: Forex, stocks, commodities, indices, and cryptocurrencies.
Use Higher Timeframe Levels for Stronger Confirmations: If a higher timeframe support/resistance level aligns with a lower timeframe level, it may indicate a stronger price reaction.
🎯 Who Should Use This Indicator?
📌 Scalpers & Day Traders – Identify short-term support and resistance levels for quick trades.
📌 Swing Traders – Utilize higher timeframe levels for position entries and exits.
📌 Trend Traders – Confirm breakout zones and key price levels for trend-following strategies.
📌 Reversal Traders – Spot potential reversal zones at significant S&R levels.
Skrip open-source
Dengan semangat TradingView yang sesungguhnya, pembuat skrip ini telah menjadikannya sebagai sumber terbuka, sehingga para trader dapat meninjau dan memverifikasi fungsinya. Salut untuk penulisnya! Meskipun Anda dapat menggunakannya secara gratis, perlu diingat bahwa penerbitan ulang kode ini tunduk pada Tata Tertib kami.
Pernyataan Penyangkalan
Informasi dan publikasi ini tidak dimaksudkan, dan bukan merupakan, saran atau rekomendasi keuangan, investasi, trading, atau jenis lainnya yang diberikan atau didukung oleh TradingView. Baca selengkapnya di Ketentuan Penggunaan.