OPEN-SOURCE SCRIPT
Diupdate [blackcat] L2 Ehlers Signal to Noise Indicator
Level: 2
Background
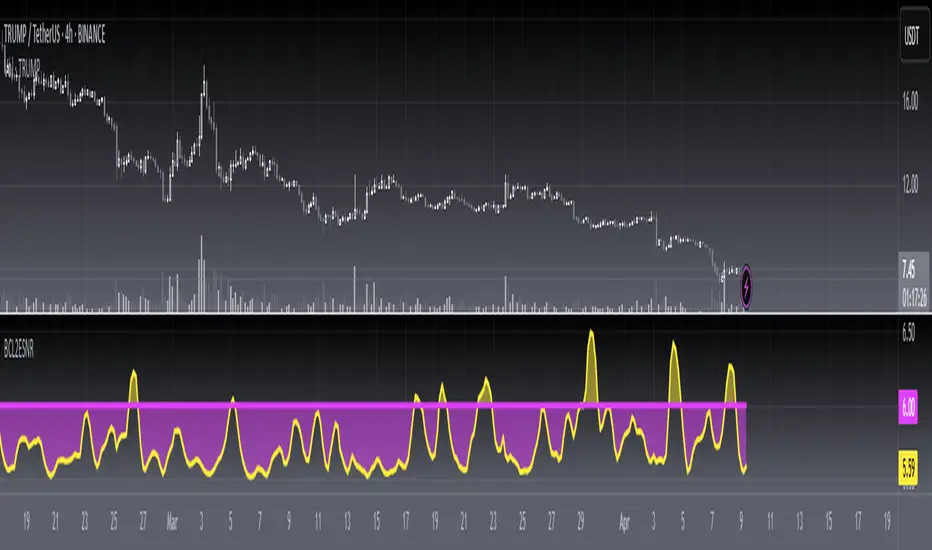
John F. Ehlers introuced Signal to Noise Indicator in his "Rocket Science for Traders" chapter 8. Dr. Ehlers terms the case where half the average daily trading range is equal to the signal amplitude as our zero decibel Signal-to-Noise Ratio (0 dB SNR) condition. He wants the signal amplitude to be at least twice the noise amplitude (6dB SNR) so that there exists a reasonable chance to make a profit from the chart analysis.
Function
blackcat L2 Ehlers Signal to Noise Indicator is used to measure Signal-to-Noise Ratio (SNR). The SNR in decibels is calculated in a single line of code near the end. The signal power is divided by the noise power to get a power ratio. The logarithm of the power ratio. At 0 dB, the peak-to-peak noise signal is twice the amplitude of the signal. Therefore, when we compute the 0 dB case, the ratio is calculated to be 10*log(1/2)^2 = -6 dB. We must then add 6 dB back into the computation to remove this bias, establishing the definition of 0 dB SNR.
Key Signal
Smooth --> 4 bar WMA w/ 1 bar lag
Detrender --> The amplitude response of a minimum-length HT can be improved by adjusting the filter coefficients by
trial and error. HT does not allow DC component at zero frequency for transformation. So, Detrender is used to remove DC component/ trend component.
Q1 --> Quadrature phase signal
I1 --> In-phase signal
Period --> Dominant Cycle in bars
SNR --> Signal-to-Noise Ratio
Pros and Cons
100% John F. Ehlers definition translation of original work, even variable names are the same. This help readers who would like to use pine to read his book. If you had read his works, then you will be quite familiar with my code style.
Remarks
The 5th script for Blackcat1402 John F. Ehlers Week publication.
Readme
In real life, I am a prolific inventor. I have successfully applied for more than 60 international and regional patents in the past 12 years. But in the past two years or so, I have tried to transfer my creativity to the development of trading strategies. Tradingview is the ideal platform for me. I am selecting and contributing some of the hundreds of scripts to publish in Tradingview community. Welcome everyone to interact with me to discuss these interesting pine scripts.
The scripts posted are categorized into 5 levels according to my efforts or manhours put into these works.
Level 1 : interesting script snippets or distinctive improvement from classic indicators or strategy. Level 1 scripts can usually appear in more complex indicators as a function module or element.
Level 2 : composite indicator/strategy. By selecting or combining several independent or dependent functions or sub indicators in proper way, the composite script exhibits a resonance phenomenon which can filter out noise or fake trading signal to enhance trading confidence level.
Level 3 : comprehensive indicator/strategy. They are simple trading systems based on my strategies. They are commonly containing several or all of entry signal, close signal, stop loss, take profit, re-entry, risk management, and position sizing techniques. Even some interesting fundamental and mass psychological aspects are incorporated.
Level 4 : script snippets or functions that do not disclose source code. Interesting element that can reveal market laws and work as raw material for indicators and strategies. If you find Level 1~2 scripts are helpful, Level 4 is a private version that took me far more efforts to develop.
Level 5 : indicator/strategy that do not disclose source code. private version of Level 3 script with my accumulated script processing skills or a large number of custom functions. I had a private function library built in past two years. Level 5 scripts use many of them to achieve private trading strategy.
Background
John F. Ehlers introuced Signal to Noise Indicator in his "Rocket Science for Traders" chapter 8. Dr. Ehlers terms the case where half the average daily trading range is equal to the signal amplitude as our zero decibel Signal-to-Noise Ratio (0 dB SNR) condition. He wants the signal amplitude to be at least twice the noise amplitude (6dB SNR) so that there exists a reasonable chance to make a profit from the chart analysis.
Function
blackcat L2 Ehlers Signal to Noise Indicator is used to measure Signal-to-Noise Ratio (SNR). The SNR in decibels is calculated in a single line of code near the end. The signal power is divided by the noise power to get a power ratio. The logarithm of the power ratio. At 0 dB, the peak-to-peak noise signal is twice the amplitude of the signal. Therefore, when we compute the 0 dB case, the ratio is calculated to be 10*log(1/2)^2 = -6 dB. We must then add 6 dB back into the computation to remove this bias, establishing the definition of 0 dB SNR.
Key Signal
Smooth --> 4 bar WMA w/ 1 bar lag
Detrender --> The amplitude response of a minimum-length HT can be improved by adjusting the filter coefficients by
trial and error. HT does not allow DC component at zero frequency for transformation. So, Detrender is used to remove DC component/ trend component.
Q1 --> Quadrature phase signal
I1 --> In-phase signal
Period --> Dominant Cycle in bars
SNR --> Signal-to-Noise Ratio
Pros and Cons
100% John F. Ehlers definition translation of original work, even variable names are the same. This help readers who would like to use pine to read his book. If you had read his works, then you will be quite familiar with my code style.
Remarks
The 5th script for Blackcat1402 John F. Ehlers Week publication.
Readme
In real life, I am a prolific inventor. I have successfully applied for more than 60 international and regional patents in the past 12 years. But in the past two years or so, I have tried to transfer my creativity to the development of trading strategies. Tradingview is the ideal platform for me. I am selecting and contributing some of the hundreds of scripts to publish in Tradingview community. Welcome everyone to interact with me to discuss these interesting pine scripts.
The scripts posted are categorized into 5 levels according to my efforts or manhours put into these works.
Level 1 : interesting script snippets or distinctive improvement from classic indicators or strategy. Level 1 scripts can usually appear in more complex indicators as a function module or element.
Level 2 : composite indicator/strategy. By selecting or combining several independent or dependent functions or sub indicators in proper way, the composite script exhibits a resonance phenomenon which can filter out noise or fake trading signal to enhance trading confidence level.
Level 3 : comprehensive indicator/strategy. They are simple trading systems based on my strategies. They are commonly containing several or all of entry signal, close signal, stop loss, take profit, re-entry, risk management, and position sizing techniques. Even some interesting fundamental and mass psychological aspects are incorporated.
Level 4 : script snippets or functions that do not disclose source code. Interesting element that can reveal market laws and work as raw material for indicators and strategies. If you find Level 1~2 scripts are helpful, Level 4 is a private version that took me far more efforts to develop.
Level 5 : indicator/strategy that do not disclose source code. private version of Level 3 script with my accumulated script processing skills or a large number of custom functions. I had a private function library built in past two years. Level 5 scripts use many of them to achieve private trading strategy.
Catatan Rilis
OVERVIEWThis script calculates the L2 Ehlers Signal to Noise Indicator (SNR) using a combination of Hilbert Transform and Homodyne Discriminator. It plots the SNR indicator and compares it to a reference level, filling the area between them based on whether the SNR is above or below the reference.
FEATURES
Source: The price source for the calculation (default is HL2).
Smooth Period: The period for smoothing the signal (default is 10).
SNR Calculation: Uses Hilbert Transform and Homodyne Discriminator to compute the SNR.
Plotting: Displays the SNR indicator and a reference line, with shading indicating whether the SNR is above or below the reference.
HOW TO USE
Add the script to your chart.
Adjust the Source and Smooth Period inputs as needed.
Observe the SNR indicator and reference line on the chart.
The shaded area indicates whether the SNR is above or below the reference level.
LIMITATIONS
The script may not perform optimally on very short timeframes.
The reference level is fixed at 6, which might need adjustment for different markets.
NOTES
This script is based on Ehlers' work and is intended for educational purposes.
For more advanced usage, consider adjusting the parameters or adding additional filters.
Skrip open-source
Dengan semangat TradingView yang sesungguhnya, pembuat skrip ini telah menjadikannya sebagai sumber terbuka, sehingga para trader dapat meninjau dan memverifikasi fungsinya. Salut untuk penulisnya! Meskipun Anda dapat menggunakannya secara gratis, perlu diingat bahwa penerbitan ulang kode ini tunduk pada Tata Tertib kami.
Avoid losing contact!Don't miss out! The first and most important thing to do is to join my Discord chat now! Click here to start your adventure: discord.com/invite/ZTGpQJq 防止失联,请立即行动,加入本猫聊天群: discord.com/invite/ZTGpQJq
Pernyataan Penyangkalan
Informasi dan publikasi ini tidak dimaksudkan, dan bukan merupakan, saran atau rekomendasi keuangan, investasi, trading, atau jenis lainnya yang diberikan atau didukung oleh TradingView. Baca selengkapnya di Ketentuan Penggunaan.