OPEN-SOURCE SCRIPT
Laguerre Stochastic | Adulari
Description:
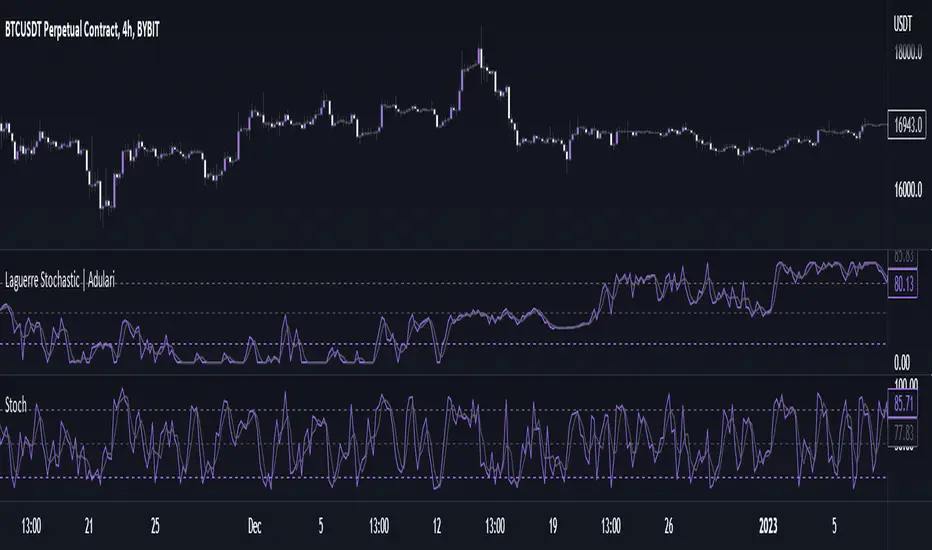
The Laguerre Stochastic is similar to a 4-period regular Stochastic, except that a Laguerre transform has been applied for price smoothing. The Laguerre transform is a mathematical technique that allows smooth indicators to be built using small amounts of data.
How do I use it?
Features:
How does it work?
1 — Calculate regular Stochastic value.
2 — Apply the Laguerre transform.
3 — Calculate %D value by applying smoothing to the %K value.
The Laguerre Stochastic is similar to a 4-period regular Stochastic, except that a Laguerre transform has been applied for price smoothing. The Laguerre transform is a mathematical technique that allows smooth indicators to be built using small amounts of data.
How do I use it?
- Never use this indicator as standalone trading signal, it should be used as confluence.
- When the value is above the middle line this shows the bullish trend is strong.
- When the value is below the middle line this shows the bearish trend is strong.
- When the value crosses above the upper line this indicates the trend may reverse downwards.
- When the value crosses below the lower line this indicates the trend may reverse upwards.
- When the value crosses above the signal this indicates the current bearish trend is getting weak and may reverse upwards.
- When the value crosses below the signal this indicates the current bullish trend is getting weak and may reverse downwards.
Features:
- Oscillator value indicating the difference between highs and lows fractioned by the close price.
- %D value acting as a smoothed version of the %K.
- Horizontal lines such as oversold, overbought and middle lines, indicating possible interest zones.
How does it work?
1 — Calculate regular Stochastic value.
2 — Apply the Laguerre transform.
3 — Calculate %D value by applying smoothing to the %K value.
Skrip open-source
Dengan semangat TradingView yang sesungguhnya, pembuat skrip ini telah menjadikannya sebagai sumber terbuka, sehingga para trader dapat meninjau dan memverifikasi fungsinya. Salut untuk penulisnya! Meskipun Anda dapat menggunakannya secara gratis, perlu diingat bahwa penerbitan ulang kode ini tunduk pada Tata Tertib kami.
Pernyataan Penyangkalan
Informasi dan publikasi ini tidak dimaksudkan, dan bukan merupakan, saran atau rekomendasi keuangan, investasi, trading, atau jenis lainnya yang diberikan atau didukung oleh TradingView. Baca selengkapnya di Ketentuan Penggunaan.