OPEN-SOURCE SCRIPT
Diupdate Macro Timeframes with Opening Price
Description: Macro Timeframe Horizontal Line Indicator
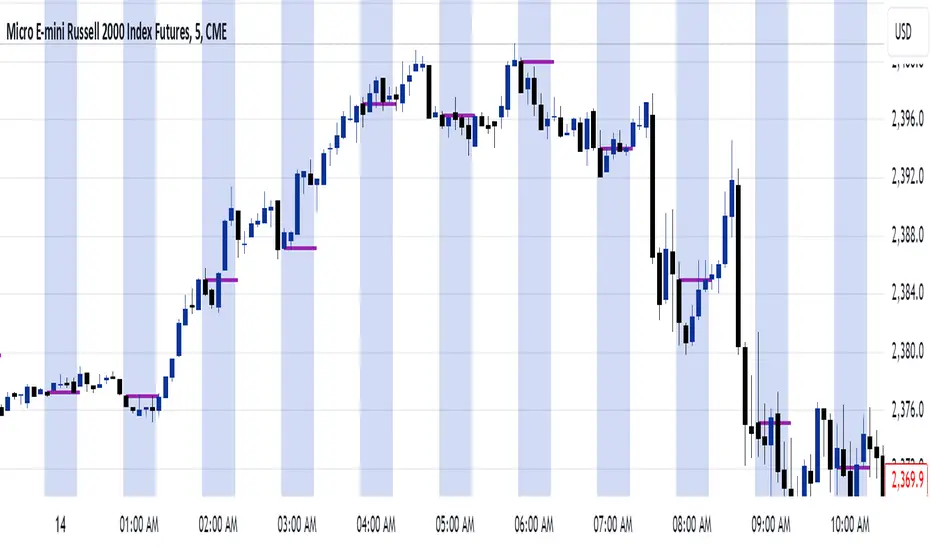
This indicator highlights macro periods on the chart by drawing a horizontal line at the opening price of each macro period. The macro timeframe is defined as the last 10 minutes of an hour (from :50 to :00) and the first 10 minutes of the following hour (from :00 to :10).
A horizontal black line is plotted at the opening price of the macro period, starting at :50 and extending through the duration of the macro window. However, you can customize it however you see fit.
The background of the macro period is highlighted with a customizable color to visually distinguish the timeframe.
The horizontal line updates at each macro period, ensuring that the opening price for every macro session is accurately reflected on the chart.
This tool is useful for traders who want to track the behavior of price within key macro intervals and visually assess price movement and volatility during these periods.
Catatan Rilis
This script highlights macro periods on the chart and draws a line representing the open of the macro.The background highlight is visible on the chart when the timeframe is 15 mins or less.
The length of the macros opening price is also adjusted so it is variable with the timeframe. Shorter lengths for the higher timeframes while longer lengths for the lower timeframes.
Catatan Rilis
I adjusted the length again to account for the timeframes <1 minuteCatatan Rilis
Added in the ability to change the color and thickness of the line of the MOP.Skrip open-source
Dengan semangat TradingView yang sesungguhnya, pembuat skrip ini telah menjadikannya sebagai sumber terbuka, sehingga para trader dapat meninjau dan memverifikasi fungsinya. Salut untuk penulisnya! Meskipun Anda dapat menggunakannya secara gratis, perlu diingat bahwa penerbitan ulang kode ini tunduk pada Tata Tertib kami.
Pernyataan Penyangkalan
Informasi dan publikasi ini tidak dimaksudkan, dan bukan merupakan, saran atau rekomendasi keuangan, investasi, trading, atau jenis lainnya yang diberikan atau didukung oleh TradingView. Baca selengkapnya di Ketentuan Penggunaan.
Skrip open-source
Dengan semangat TradingView yang sesungguhnya, pembuat skrip ini telah menjadikannya sebagai sumber terbuka, sehingga para trader dapat meninjau dan memverifikasi fungsinya. Salut untuk penulisnya! Meskipun Anda dapat menggunakannya secara gratis, perlu diingat bahwa penerbitan ulang kode ini tunduk pada Tata Tertib kami.
Pernyataan Penyangkalan
Informasi dan publikasi ini tidak dimaksudkan, dan bukan merupakan, saran atau rekomendasi keuangan, investasi, trading, atau jenis lainnya yang diberikan atau didukung oleh TradingView. Baca selengkapnya di Ketentuan Penggunaan.