OPEN-SOURCE SCRIPT
MACD Indicator with Buy and Sell Alerts
Introduction
The MACD Indicator with Alerts & Manual Thresholds is a powerful and customizable MACD-based trading tool designed for traders who want more control over their buy and sell signals. This script allows users to define their own buy and sell thresholds instead of relying solely on standard MACD crossovers. The built-in alerts help traders stay informed about potential trade opportunities without constantly monitoring charts.
How It Works
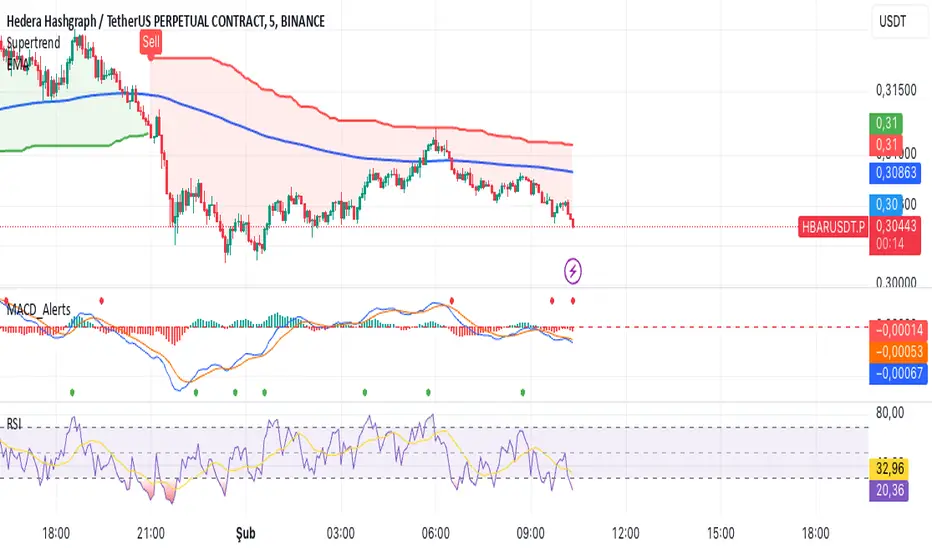
This script calculates the Moving Average Convergence Divergence (MACD) using customizable fast and slow moving averages. The MACD histogram is derived from the difference between the MACD line and the signal line:
MACD Line: The difference between a fast-moving average (default 12-period EMA) and a slow-moving average (default 26-period EMA).
Signal Line: A smoothed moving average (default 9-period EMA) of the MACD line.
Histogram: The difference between the MACD line and the signal line.
Instead of using default zero-line crossovers, this script allows traders to set custom buy and sell threshold levels:
A buy signal is generated when the MACD histogram crosses above the user-defined buy threshold.
A sell signal is generated when the MACD histogram crosses below the user-defined sell threshold.
Benefits of This Indicator
Custom Thresholds: Unlike traditional MACD indicators, traders can adjust buy and sell thresholds according to their strategy.
Automated Alerts: Get notified instantly when buy or sell conditions are met.
Flexibility in Calculation: Choose between SMA or EMA for both the MACD and signal line calculations.
Clear Visualization: Histogram bars color-coded for quick analysis.
Risks and Limitations
While the MACD indicator is a widely used tool, traders should be aware of its potential risks:
Lagging Indicator: MACD is a trend-following indicator, meaning it may generate signals with some delay.
False Signals in Ranging Markets: MACD works best in trending markets but can produce misleading signals in sideways conditions.
Threshold Optimization Required: Users need to experiment with different buy/sell thresholds to align with their trading strategy and market conditions.
Improving Accuracy with Additional Indicators
For better accuracy and confirmation, combining this MACD strategy with other indicators is recommended:
1. EMA 200 as a Trend Filter
Use the 200-period EMA to determine the overall trend direction.
Consider buying only when price is above EMA 200 (uptrend) and selling only when price is below EMA 200 (downtrend).
2. RSI (Relative Strength Index) for Overbought/Oversold Conditions
RSI (14) can help filter false MACD signals.
A MACD buy signal is stronger when RSI is below 30 (oversold condition).
A MACD sell signal is more reliable when RSI is above 70 (overbought condition).
3. Support & Resistance Levels
Consider placing trades near major support or resistance zones to avoid chasing breakouts.
MACD signals are more effective when they align with these key price levels.
Conclusion
The MACD Indicator with Alerts & Manual Thresholds offers a flexible and powerful approach to trading by allowing users to define their own thresholds. However, for best results, it should be combined with additional indicators such as EMA 200, RSI, and support/resistance levels. Traders should backtest and optimize settings to suit their market conditions and trading style.
By using this indicator alongside proper risk management techniques, traders can enhance their decision-making process and improve their overall trading performance.
Happy Trading!
The MACD Indicator with Alerts & Manual Thresholds is a powerful and customizable MACD-based trading tool designed for traders who want more control over their buy and sell signals. This script allows users to define their own buy and sell thresholds instead of relying solely on standard MACD crossovers. The built-in alerts help traders stay informed about potential trade opportunities without constantly monitoring charts.
How It Works
This script calculates the Moving Average Convergence Divergence (MACD) using customizable fast and slow moving averages. The MACD histogram is derived from the difference between the MACD line and the signal line:
MACD Line: The difference between a fast-moving average (default 12-period EMA) and a slow-moving average (default 26-period EMA).
Signal Line: A smoothed moving average (default 9-period EMA) of the MACD line.
Histogram: The difference between the MACD line and the signal line.
Instead of using default zero-line crossovers, this script allows traders to set custom buy and sell threshold levels:
A buy signal is generated when the MACD histogram crosses above the user-defined buy threshold.
A sell signal is generated when the MACD histogram crosses below the user-defined sell threshold.
Benefits of This Indicator
Custom Thresholds: Unlike traditional MACD indicators, traders can adjust buy and sell thresholds according to their strategy.
Automated Alerts: Get notified instantly when buy or sell conditions are met.
Flexibility in Calculation: Choose between SMA or EMA for both the MACD and signal line calculations.
Clear Visualization: Histogram bars color-coded for quick analysis.
Risks and Limitations
While the MACD indicator is a widely used tool, traders should be aware of its potential risks:
Lagging Indicator: MACD is a trend-following indicator, meaning it may generate signals with some delay.
False Signals in Ranging Markets: MACD works best in trending markets but can produce misleading signals in sideways conditions.
Threshold Optimization Required: Users need to experiment with different buy/sell thresholds to align with their trading strategy and market conditions.
Improving Accuracy with Additional Indicators
For better accuracy and confirmation, combining this MACD strategy with other indicators is recommended:
1. EMA 200 as a Trend Filter
Use the 200-period EMA to determine the overall trend direction.
Consider buying only when price is above EMA 200 (uptrend) and selling only when price is below EMA 200 (downtrend).
2. RSI (Relative Strength Index) for Overbought/Oversold Conditions
RSI (14) can help filter false MACD signals.
A MACD buy signal is stronger when RSI is below 30 (oversold condition).
A MACD sell signal is more reliable when RSI is above 70 (overbought condition).
3. Support & Resistance Levels
Consider placing trades near major support or resistance zones to avoid chasing breakouts.
MACD signals are more effective when they align with these key price levels.
Conclusion
The MACD Indicator with Alerts & Manual Thresholds offers a flexible and powerful approach to trading by allowing users to define their own thresholds. However, for best results, it should be combined with additional indicators such as EMA 200, RSI, and support/resistance levels. Traders should backtest and optimize settings to suit their market conditions and trading style.
By using this indicator alongside proper risk management techniques, traders can enhance their decision-making process and improve their overall trading performance.
Happy Trading!
Skrip open-source
Dengan semangat TradingView yang sesungguhnya, penulis skrip ini telah menerbitkannya sebagai sumber terbuka, sehingga para trader dapat memahami dan memverifikasinya. Hormat untuk penulisnya! Anda dapat menggunakannya secara gratis, namun penggunaan kembali kode ini dalam publikasi diatur oleh Tata Tertib. Anda dapat memfavoritkannya untuk digunakan pada chart
Inggin menggunakan skrip ini pada chart?
Pernyataan Penyangkalan
Informasi dan publikasi tidak dimaksudkan untuk menjadi, dan bukan merupakan saran keuangan, investasi, perdagangan, atau rekomendasi lainnya yang diberikan atau didukung oleh TradingView. Baca selengkapnya di Persyaratan Penggunaan.