OPEN-SOURCE SCRIPT
Diupdate On Balance Volume Modified
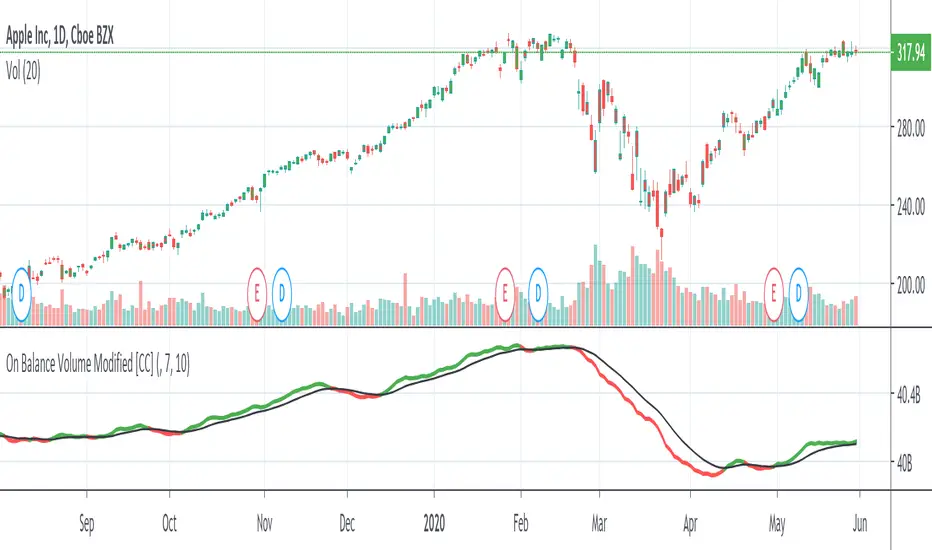
Here is a smoothed version of the classic OBV indicator with a signal line. You can use it to look for signal line crossovers and divergences. The signal line is a 10-day EMA of the OBVM line. Typically, the signal line can vary from 10 to 50.
This was just published by Vitali Apirine in the latest issue of Stocks & Commodities (April 2020) p22-25
Please let me know if you want me to publish any other indicators or if you have any questions!
This was just published by Vitali Apirine in the latest issue of Stocks & Commodities (April 2020) p22-25
Please let me know if you want me to publish any other indicators or if you have any questions!
Catatan Rilis
updated to match my other indicatorsCatatan Rilis
fixed issue with default resolutionSkrip open-source
Dengan semangat TradingView yang sesungguhnya, pembuat skrip ini telah menjadikannya sebagai sumber terbuka, sehingga para trader dapat meninjau dan memverifikasi fungsinya. Salut untuk penulisnya! Meskipun Anda dapat menggunakannya secara gratis, perlu diingat bahwa penerbitan ulang kode ini tunduk pada Tata Tertib kami.
Pernyataan Penyangkalan
Informasi dan publikasi ini tidak dimaksudkan, dan bukan merupakan, saran atau rekomendasi keuangan, investasi, trading, atau jenis lainnya yang diberikan atau didukung oleh TradingView. Baca selengkapnya di Ketentuan Penggunaan.
Skrip open-source
Dengan semangat TradingView yang sesungguhnya, pembuat skrip ini telah menjadikannya sebagai sumber terbuka, sehingga para trader dapat meninjau dan memverifikasi fungsinya. Salut untuk penulisnya! Meskipun Anda dapat menggunakannya secara gratis, perlu diingat bahwa penerbitan ulang kode ini tunduk pada Tata Tertib kami.
Pernyataan Penyangkalan
Informasi dan publikasi ini tidak dimaksudkan, dan bukan merupakan, saran atau rekomendasi keuangan, investasi, trading, atau jenis lainnya yang diberikan atau didukung oleh TradingView. Baca selengkapnya di Ketentuan Penggunaan.