OPEN-SOURCE SCRIPT
Volume DI Diff + ADX Coloreado por AO
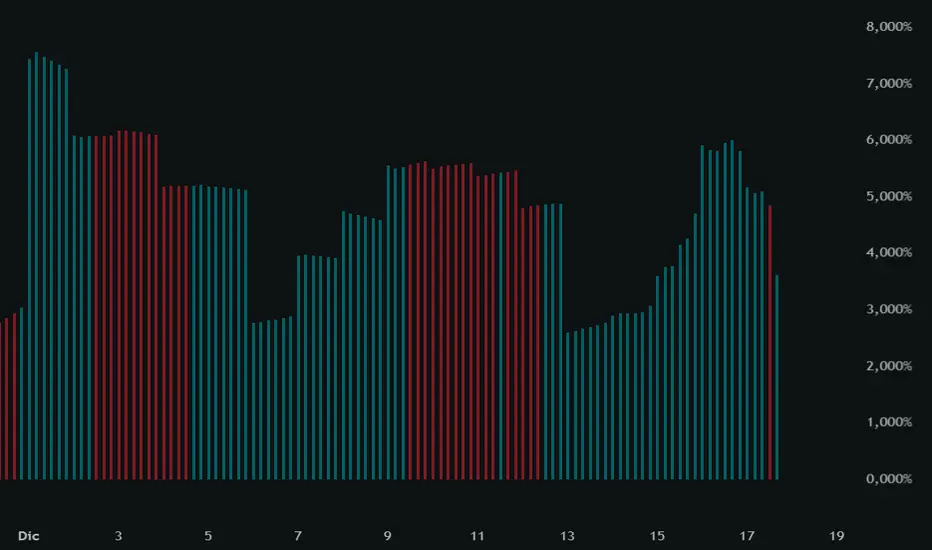
InterpretationIf +DI > -DI (positive DI+ - DI- difference) → Upward trend pressure (bullish signal).
If -DI > +DI (negative DI+ - DI- difference) → Downward trend pressure (bearish signal).
Crossovers between +DI and -DI generate buy/sell signals, often filtered by ADX for reliability.
This setup is widely used in technical analysis to identify trending markets and avoid whipsaws in ranging conditions. It's part of the broader Average Directional Movement System (ADX/DMI).
Key ComponentsADX line: Measures overall trend strength (non-directional).
+DI line: Strength of upward movement.
-DI line: Strength of downward movement.
Trend direction is determined by which DI line is dominant:+DI > -DI: Bullish trend (upward pressure).
-DI > +DI: Bearish trend (downward pressure).
Crossovers between +DI and -DI can signal potential trend changes, but they are most reliable when ADX confirms sufficient strength.ADX Trend Strength Levels (Common Interpretations)ADX Value
Trend Strength
Recommendation
0–20
Weak or no trend (ranging/sideways market)
Avoid trend-following strategies; consider range-bound or oscillator-based trades.
20–25
Emerging or moderate trend (gray zone)
Monitor for confirmation; potential start of trend.
25–50
Strong trend
Ideal for trend-following strategies (e.g., moving averages, breakouts).
50–75
Very strong trend
High momentum; good for riding trends, but watch for exhaustion.
75–100
Extremely strong trend (rare)
Often overextended; risk of reversal or correction.
Rising ADX: Trend is strengthening.
Falling ADX: Trend is weakening (even if still high).
Skrip open-source
Dengan semangat TradingView yang sesungguhnya, pembuat skrip ini telah menjadikannya sebagai sumber terbuka, sehingga para trader dapat meninjau dan memverifikasi fungsinya. Salut untuk penulisnya! Meskipun Anda dapat menggunakannya secara gratis, perlu diingat bahwa penerbitan ulang kode ini tunduk pada Tata Tertib kami.
Pernyataan Penyangkalan
Informasi dan publikasi ini tidak dimaksudkan, dan bukan merupakan, saran atau rekomendasi keuangan, investasi, trading, atau jenis lainnya yang diberikan atau didukung oleh TradingView. Baca selengkapnya di Ketentuan Penggunaan.