OPEN-SOURCE SCRIPT
Break of High/Low with Volume, MACD, and MAs

How It Works:
Sessions:
The London session is defined between 8:00 and 16:00 UTC.
The New York session is defined between 13:00 and 21:00 UTC.
Previous High/Low:
The script identifies the highest high and lowest low from the previous bar using ta.highest(high, 1)[1] and ta.lowest(low, 1)[1].
Candle Body Size:
The script calculates the size of the current candle's body and checks if it is at least double the size of the previous candle's body.
Volume Check:
A high volume threshold is set as 1.5 times the 50-period SMA of the volume.
MACD Crossover:
The script calculates the MACD and its signal line and checks for bullish (buy) or bearish (sell) crossovers.
Signals:
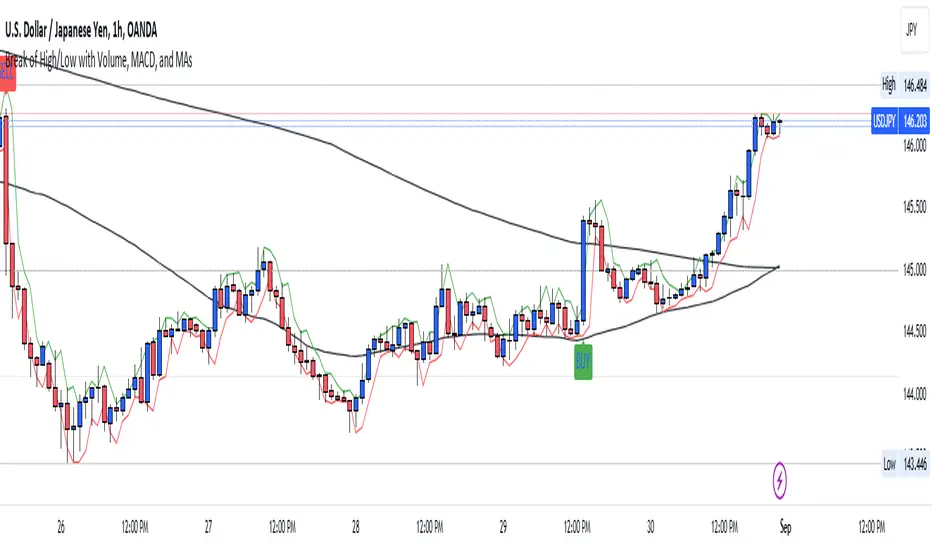
A long signal (buy) is generated if the price breaks the previous high with a large body candle, high volume, and a bullish MACD crossover during the specified sessions.
A short signal (sell) is generated if the price breaks the previous low with a large body candle, high volume, and a bearish MACD crossover during the specified sessions.
Plotting:
The 50-period and 200-period moving averages, previous high, and previous low are plotted on the chart.
If a long condition is met, a "BUY" label is displayed below the bar. If a short condition is met, a "SELL" label is displayed above the bar.
Alerts:
Alerts are triggered whenever the conditions for a long or short trade are met.
Customization:
Feel free to adjust the session times, volume threshold, MACD settings, or moving averages based on your trading strategy or the specific asset you are trading.
Skrip open-source
Dengan semangat TradingView yang sesungguhnya, pembuat skrip ini telah menjadikannya sebagai sumber terbuka, sehingga para trader dapat meninjau dan memverifikasi fungsinya. Salut untuk penulisnya! Meskipun Anda dapat menggunakannya secara gratis, perlu diingat bahwa penerbitan ulang kode ini tunduk pada Tata Tertib kami.
Pernyataan Penyangkalan
Informasi dan publikasi ini tidak dimaksudkan, dan bukan merupakan, saran atau rekomendasi keuangan, investasi, trading, atau jenis lainnya yang diberikan atau didukung oleh TradingView. Baca selengkapnya di Ketentuan Penggunaan.