OPEN-SOURCE SCRIPT
Diupdate Monthly Weekly Daily Hourly CLOSES
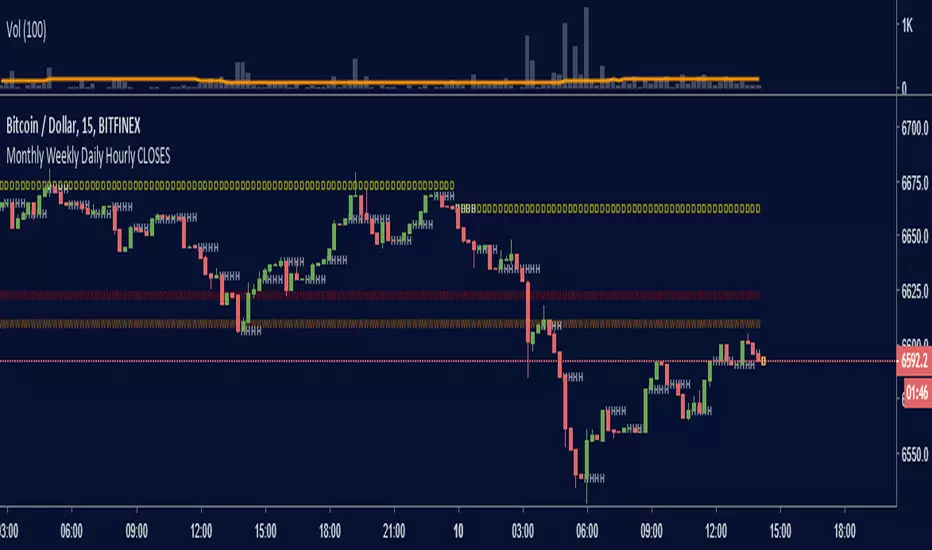
Draws horizontal segments where the last Monthly, Weekly, Daily and Hourly closes are.
Easily identify current price relative position to these key prices.
I use it as a kind of pivot points and help me with trend following entries: longs if up from last close, shorts if down from last close.
Monthly: red line (MMMMM)
Weekly: orange line (WWWWW)
Daily: yellow line (DDDDD)
Hourly: white line (HHHHH)
//Original idea from "Key Levels [treypeng]
Catatan Rilis
Added high / low for each periodAdjusted colors and character for visibility
Skrip open-source
Dengan semangat TradingView yang sesungguhnya, pembuat skrip ini telah menjadikannya sebagai sumber terbuka, sehingga para trader dapat meninjau dan memverifikasi fungsinya. Salut untuk penulisnya! Meskipun Anda dapat menggunakannya secara gratis, perlu diingat bahwa penerbitan ulang kode ini tunduk pada Tata Tertib kami.
Pernyataan Penyangkalan
Informasi dan publikasi ini tidak dimaksudkan, dan bukan merupakan, saran atau rekomendasi keuangan, investasi, trading, atau jenis lainnya yang diberikan atau didukung oleh TradingView. Baca selengkapnya di Ketentuan Penggunaan.