Wyckoff Dual Wave
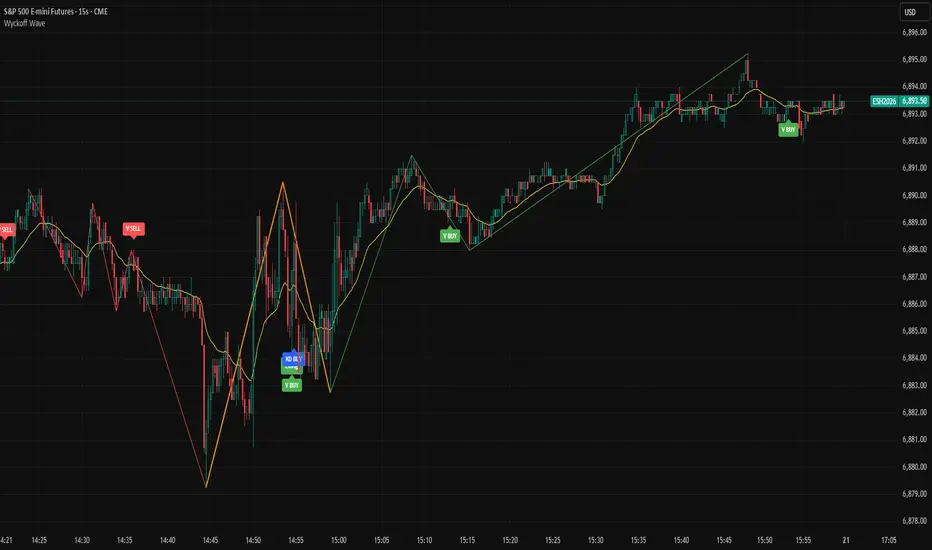
This Pine Script v5 indicator is built for TradingView, based on Wyckoff Theory. It runs in overlay mode on price charts, featuring dual-wave monitoring for short-term small waves and medium-term large waves. It generates trading signals by combining moving averages, volume analysis, double top/bottom patterns, and KD stochastic indicators. The indicator is suitable for short-term and scalping trading, and can be applied to time frames such as 15 seconds, 1 minute, 3 minutes, and 5 minutes to capture price fluctuations while filtering false signals. It should be noted that the default parameters of this indicator are preset for the 15-second time frame.
2. Some of my thoughts
Wyckoff Wave focuses on dynamic analysis. We need to observe the contest for wave highs and lows. Cumulative trading volume, average volume, and the maximum volume at highs and lows are all helpful for analysis. For the sake of simple and convenient comparison, I only use cumulative trading volume.
For wave analysis, it is necessary for us to refer to the trend of larger time frames. That’s why I use two levels of waves. Instead of adopting specific time frames, I choose large moving averages because, from a certain perspective, large moving averages represent the time frame corresponding to the moving average itself—even more reliably.
3. Input Parameters Explanation
3.1 Core Wave Parameters
Small Wave MA: Default value 50. This is the EMA period used as the base for small wave analysis to define short-term trend boundaries.
Signal MA: Default value 20. This fast EMA is used for double top/bottom signal validation and price crossover detection.
Large Wave MA: Default value 200. This is the EMA period used as the base for large wave analysis to define medium-to-long-term trend boundaries.
PCT Factor: Default value 2.0. This is the ATR multiplier threshold for small wave reversal, controlling the sensitivity of short-term trend changes.
Wave PCT Min: Default value 0.03. This is the minimum price fluctuation percentage required to confirm a valid small wave, filtering minor price movements.
Large Wave PCT Factor: Default value 4.0. This is the ATR multiplier threshold for large wave reversal, controlling the sensitivity of medium-to-long-term trend changes.
Large Wave PCT Min: Default value 0.08. This is the minimum price fluctuation percentage required to confirm a valid large wave, filtering insignificant long-term price swings .
Large Wave Min Bars Distance: Default value 5. This is the minimum number of bars required between pivot highs and lows of large waves, preventing interference from adjacent pivot points.
Min Bars Distance Between Highs/Lows: Default value 3. This is the minimum number of bars required between pivot highs and lows of small waves, filtering dense and invalid pivot points.
3.2 Display Toggle Parameters
Show Large Wave Lines: Default value true. Enables or disables the display of large wave trend lines on the chart.
Show Small Wave MA: Default value false. Toggles the visibility of the small wave base EMA on the chart.
Show Large Wave MA: Default value false. Toggles the visibility of the large wave base EMA on the chart.
Show Signal MA: Default value true. Toggles the visibility of the signal EMA on the chart.
Show Wave: Default value true. Enables or disables the display of small wave trend lines on the chart.
Show Vol: Default value false. Toggles the visibility of volume data and volume labels on the chart.
3.3 Volume Related Parameters
Vol Divisor: Default value 100. This divisor reduces volume values for clearer label display on the chart.
Vol Dist: Default value 2.0. This controls the vertical distance between volume labels and price bars to avoid overlapping.
Vol History Limit: Default value 200. This sets the maximum number of historical volume labels to retain, preventing chart clutter.
3.4 Trend Confirmation Parameters
Trend Confirmation Type: Default value 3-Day Breakaway. It offers three options for trend confirmation rules: Original Rules confirms the trend immediately after a price break; Close Confirmation requires a closing price beyond the pivot point to confirm the trend; 3-Day Breakaway requires three consecutive closing prices beyond the pivot point to validate the trend.
3.5 Signal Display Parameters
Show Long Signals: Default value true. Enables or disables the display of long trading signals on the chart.
Show Short Signals: Default value true. Enables or disables the display of short trading signals on the chart.
Enable Volume Compare Long Signals: Default value true. Triggers additional long signals when pullback volume is lower than the volume of the prior rally phase.
Enable Volume Compare Short Signals: Default value true. Triggers additional short signals when rally volume is lower than the volume of the prior decline phase.
Enable KD Signals: Default value true. Enables or disables trading signals generated by the KD stochastic indicator.
3.6 Pattern Recognition Parameters
Double Pattern ATR Multiplier: Default value 0.0, range from -5.0 to 5.0 with step 0.1. This ATR multiplier is used to calculate the threshold for double top/bottom pattern validation, adjusting the strictness of pattern recognition.
3.7 KD Stochastic Parameters
KD %K Length: Default value 14, minimum 1. This is the calculation period for the %K line of the KD indicator.
KD %K Smoothing: Default value 3, minimum 1. This is the smoothing period for the %K line of the KD indicator.
KD %D Smoothing: Default value 3, minimum 1. This is the calculation period for the %D line of the KD indicator.
KD Overbought Level: Default value 80, range from 50 to 100. This sets the overbought threshold for the KD indicator; values above this level suggest potential short opportunities.
KD Oversold Level: Default value 20, range from 0 to 50. This sets the oversold threshold for the KD indicator; values below this level suggest potential long opportunities.
3.8 Color Customization Parameters
Up Trend Color: Default value green. This is the color used for small wave uptrend lines and related long signal labels.
Down Trend Color: Default value red. This is the color used for small wave downtrend lines and related short signal labels.
Large Wave Up Color: Default value lime. This is the color used for large wave uptrend lines.
Large Wave Down Color: Default value orange. This is the color used for large wave downtrend lines.
4. How to Read Signals and Trade
4.1 Basic Trend Identification
Small Wave Trend: Identified by green (uptrend) or red (downtrend) lines on the chart. Follow small wave trends for short-term trades.
Large Wave Trend: Identified by lime (uptrend) or orange (downtrend) lines. Use large wave trends to filter trades—only take long signals in large uptrends and short signals in large downtrends for higher win rates.
4.2 Trading Signal Types and Usage
Basic Long/Short Signals
Long Signal: Displayed as "Long" label below the price bar. Triggered when price crosses above Signal MA in a small uptrend. Enter long positions on this signal.
Short Signal: Displayed as "Short" label above the price bar. Triggered when price crosses below Signal MA in a small downtrend. Enter short positions on this signal.
Pattern-Based Signals
Double Bottom Buy Signal: Displayed as "DB BUY" or "DBOT" label. Triggered when a double bottom pattern forms in an uptrend. This is a strong long signal—use it for high-confidence entries.
Double Top Short Signal: Displayed as "DT SELL" or "DTOP" label. Triggered when a double top pattern forms in a downtrend. This is a strong short signal.
Volume-Validated Signals
Volume Long Signal: Displayed as "V BUY" label. Triggered when pullback volume is lower than prior rally volume in an uptrend. This confirms buying pressure—use it to add to long positions.
Volume Short Signal: Displayed as "V SELL" label. Triggered when rally volume is lower than prior decline volume in a downtrend. This confirms selling pressure—use it to add to short positions.
KD Resonance Signals
KD Long Signal: Displayed as "KD BUY" label. Triggered when KD %K crosses above oversold level in an uptrend. Use it as a confirmation signal for long entries.
KD Short Signal: Displayed as "KD SELL" label. Triggered when KD %K crosses below overbought level in a downtrend. Use it as a confirmation signal for short entries.
4.3 Signal Filtering Rules (Reduce False Signals)
Trade with the large wave trend: Only take long signals when large wave is in uptrend; only take short signals when large wave is in downtrend.
Combine multiple signal types: Prioritize signals that have both pattern confirmation and volume validation (e.g., DB BUY + V BUY) for higher reliability.
Follow the trend confirmation type: Stick to your chosen trend confirmation rule to avoid premature entries.
5. Risk Management Tips
Do not rely on a single signal—always combine indicator signals with market context (e.g., news, support/resistance levels).
Adjust parameters based on your trading time frame and personal preferences.
Use stop-loss orders: Place stop-loss below the recent pivot low for long positions and above the recent pivot high for short positions to limit losses.
Control position sizes: Adjust position sizes according to your risk tolerance to avoid excessive losses from false signals.
Avoid overtrading: Only take signals that meet your predefined criteria to prevent unnecessary trades.
Skrip hanya-undangan
Hanya pengguna yang disetujui oleh penulis yang dapat mengakses skrip ini. Anda perlu meminta dan mendapatkan izin untuk menggunakannya. Izin ini biasanya diberikan setelah pembayaran. Untuk detail selengkapnya, ikuti petunjuk penulis di bawah ini atau hubungi gary186 secara langsung.
TradingView TIDAK menyarankan untuk membayar atau menggunakan skrip kecuali Anda sepenuhnya mempercayai pembuatnya dan memahami cara kerjanya. Anda juga dapat menemukan alternatif yang gratis dan sumber terbuka di skrip komunitas kami.
Instruksi penulis
Pernyataan Penyangkalan
Skrip hanya-undangan
Hanya pengguna yang disetujui oleh penulis yang dapat mengakses skrip ini. Anda perlu meminta dan mendapatkan izin untuk menggunakannya. Izin ini biasanya diberikan setelah pembayaran. Untuk detail selengkapnya, ikuti petunjuk penulis di bawah ini atau hubungi gary186 secara langsung.
TradingView TIDAK menyarankan untuk membayar atau menggunakan skrip kecuali Anda sepenuhnya mempercayai pembuatnya dan memahami cara kerjanya. Anda juga dapat menemukan alternatif yang gratis dan sumber terbuka di skrip komunitas kami.