PROTECTED SOURCE SCRIPT
Diupdate ZN Pivots
Description
This indicator is aimed at showing the pivot points of the trend by using Ichimoku cloud and Bollinger bands.
Warning
As a result, this indicator should be expected to give an idea of the trend direction, not a trading signal.
Version
v1.0
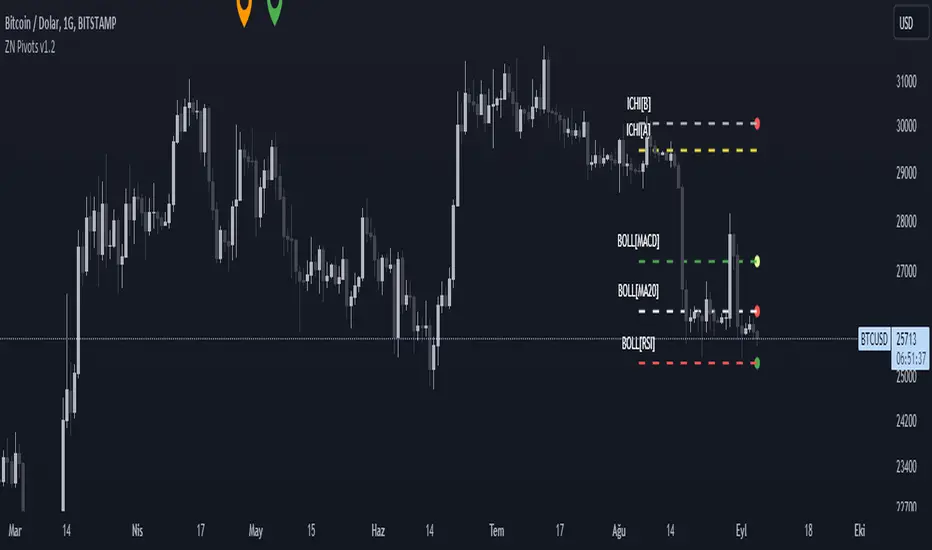
This indicator is aimed at showing the pivot points of the trend by using Ichimoku cloud and Bollinger bands.
- BOLL[MACD]: Upper Bollinger Band. The red circle formed on it refers to the downward intersection of the MACD indicator. In the downward intersection, a red circle appears.
- BOLL[MA20]: Middle Bollinger Band.
- BOLL[RSI]: Lower Bollinger Band. The red circle formed on it refers to the downward intersection of the RSI indicator. In the downward intersection, a red circle appears.
- ICHI[A]: Ichimoku Leading A Line. The green circle formed on it refers to the upward intersection of the ICHIMOKU indicator.
- ICHI[B]: Ichimoku Leading B Line. The red circle formed on it refers to the downward intersection of the ICHIMOKU indicator.
Warning
As a result, this indicator should be expected to give an idea of the trend direction, not a trading signal.
Version
v1.0
Catatan Rilis
- [ADDED] If the price closes below the middle band, a red circle is now displayed on the middle band. Otherwise, you will see a green circle.
- [CHANGED] the colors of the upper bollinger band line and the lower band line.
Catatan Rilis
- The red circle that occurs when the Ichimoku leading A line cuts down the leading B line is now displayed on the leading B.
- Fixed the issue of contraction on large time frames caused by Bollinger lower band calculation.
Catatan Rilis
- Plot plots showing indicator levels have been replaced with line plots.
- Line width increased from 10 bars to 30 bars.
Skrip terproteksi
Skrip ini diterbitkan sebagai sumber tertutup. Namun, Anda dapat menggunakannya dengan bebas dan tanpa batasan apa pun – pelajari lebih lanjut di sini.
Pernyataan Penyangkalan
Informasi dan publikasi ini tidak dimaksudkan, dan bukan merupakan, saran atau rekomendasi keuangan, investasi, trading, atau jenis lainnya yang diberikan atau didukung oleh TradingView. Baca selengkapnya di Ketentuan Penggunaan.