OPEN-SOURCE SCRIPT
Diupdate EMA Deviation Rebound
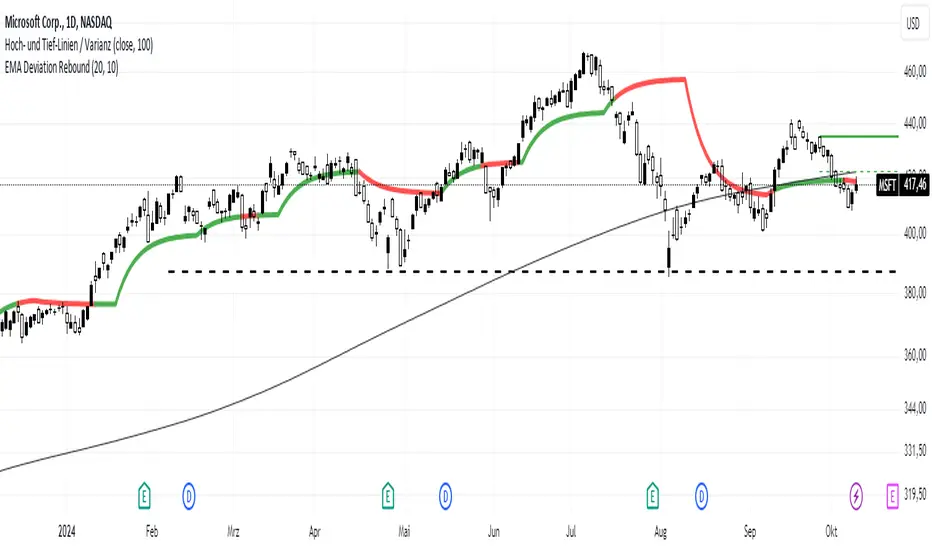
The "EMA Deviation Rebound" indicator I've created utilizes calculations involving the standard deviation of closing prices and exponential moving averages (EMA) to generate a line. The color of this line changes based on whether the EMA value is above or below the current closing price. This can be interpreted as an indicator for potential buy or sell signals:
Buy Signal: If the price crosses the indicator from bottom to top, this can be considered a buy signal. This could indicate that the price has overcome a resistance and a potential upward movement may be forthcoming.
Sell Signal: If the price crosses the indicator from top to bottom, this could serve as a sell signal. This might suggest that the price has broken a support downward and possibly indicates an impending downward movement.
The indicator is named "EMA Deviation Rebound" because I use it to identify potential resistance and support levels. When the price rebounds at the indicator, this could signify a price movement in the opposite direction.
It's important to use such indicators in conjunction with other analysis techniques and market information to make informed trading decisions.
Catatan Rilis
The indicator calculates the average of the fluctuations in the last X closing prices. This setting can be adjusted using the variable "Period." In the original version, only this value could be adjusted, and the length of the period was used for smoothing.Now, it's possible to adjust the smoothing length separately. In my opinion, this indicator works well when the line is understood as resistance or support. Often, the price tests the indicator and then moves in the opposite direction.
Catatan Rilis
The "EMA Deviation Rebound" script has now been enhanced with an alarm feature. This alarm activates whenever the color of the EMA changes, signaling potential buy or sell opportunities based on market conditions:A Buy signal (Green) is triggered when the price is above the EMA and the candle closes bullish.
A Sell signal (Red) is triggered when the price is below the EMA and the candle closes bearish.
The alarm is set to trigger only once per candle upon detecting a color change. This allows for real-time notifications, enabling better trading decisions.
Skrip open-source
Dengan semangat TradingView yang sesungguhnya, pembuat skrip ini telah menjadikannya sebagai sumber terbuka, sehingga para trader dapat meninjau dan memverifikasi fungsinya. Salut untuk penulisnya! Meskipun Anda dapat menggunakannya secara gratis, perlu diingat bahwa penerbitan ulang kode ini tunduk pada Tata Tertib kami.
Pernyataan Penyangkalan
Informasi dan publikasi ini tidak dimaksudkan, dan bukan merupakan, saran atau rekomendasi keuangan, investasi, trading, atau jenis lainnya yang diberikan atau didukung oleh TradingView. Baca selengkapnya di Ketentuan Penggunaan.