Blockunity Ultimatyx Screener (BUS)
The goal of this indicator is to give you an overview of the status of many indicators on different timeframes. It consists of a Screener and an Oscillator. The oscillator allows you to detect correlations between the indicators included in the Screener in order to give buy and sell points.
Usage Advice
There are no specific guidelines for this indicator. It works on all time units and all assets. We still recommend that you use your chart in logarithmic.
The Different Elements And Signals – The Screener
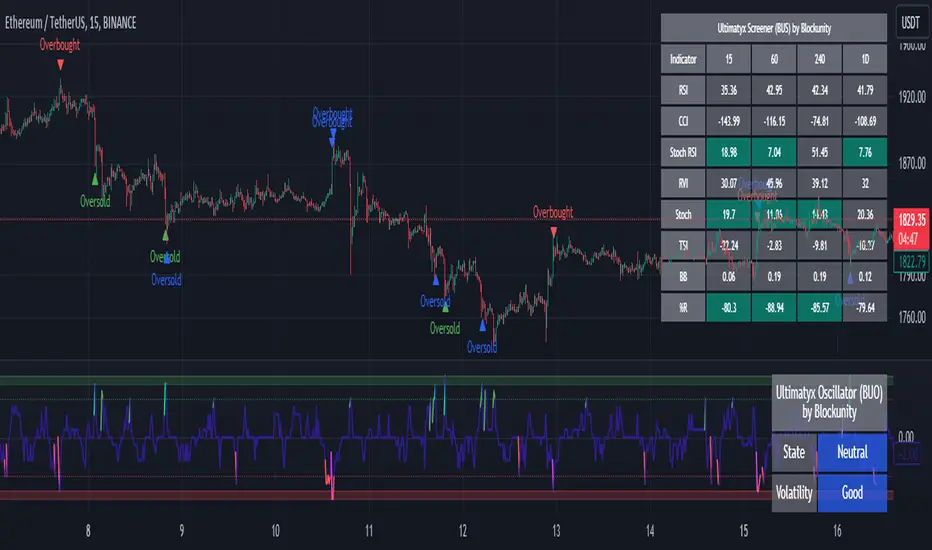
On your chart, you can find the Screener. It indicates the values of the following indicators:
- RSI (Relative Strength Index).
- CCI (Commodity Channel Index).
- Stoch RSI (Stochastic RSI).
- RVI (Relative Vigor Index).
- Stoch (Stochastic).
- TSI (True Strength Index).
- BB% (Bollinger Bands %B).
- %R (Williams Percent Range).
The background of each cell changes color if the indicator is oversold (green) or overbought (red).
In addition, it allows you to visualize all these values directly on several time units:
- Unit of the chart/the one you select.
- 1h.
- 4h.
- Daily.
- Weekly.
It is possible to change the time unit of the columns 1h, 4h, and Daily in the parameters. The first time unit column is dynamic and linked to the one you choose for your chart.
In addition, you will find directly on the chart the buy and sell points. By default, we display the « Ultimatyx » signals, which are a correlation of the different indicators present in the Screener. Of course, you are able to display the signals of your choice by modifying it in the « Style » tab of the indicator parameters.
The Different Elements And Signals – The Oscillator
The oscillator allows you to identify the moments of correlation between the different indicators of the Screener. Its color varies according to the number of indicators returning the same signal. These thresholds are configurable. The color code is as follows:
- Yellow: Heavily Oversold.
- Green: Oversold.
- Purple: Neutral.
- Red: Overbuy.
- Dark pink: Heavily Overbuy.
It's the oscillator that triggers the « Ultimatyx » signals.
- Replacement of the Rate Of Change (ROC) by the Stochastic RSI.
- Added the following technical indicators in replacement of the SMA and EMA: Bollinger Bands % and Williams Percent Range.
- Deletion for now of the 4th because of limitations.
- Added option to choose the time unit of the 3 timeframe columns in the indicator settings.
- Buy/Sell signals changed to Overbought/Oversold.
- Added a mechanism for determining volatility.
- If volatility is considered too high, signals are displayed in blue. In this case, you need to be more cautious in interpreting them, because when volatility is too high, overbought and oversold signals may be given a bit early.
- Reduced table transparency for better compatibility with White Mode.
- Change of some oscillator colors for better visualization in both modes (Dark & White).
- New data table design. Moreover, it is now fully configurable.
- Indicator name added to signals for better use in combination with other indicators.
- Some parameter values are now hidden for better readability.
- Added a version number at the end of the parameters.
Skrip hanya-undangan
Hanya pengguna yang disetujui oleh penulis yang dapat mengakses skrip ini. Anda perlu meminta dan mendapatkan izin untuk menggunakannya. Izin ini biasanya diberikan setelah pembayaran. Untuk detail selengkapnya, ikuti petunjuk penulis di bawah ini atau hubungi Blockunity secara langsung.
Harap diperhatikan bahwa skrip pribadi khusus undangan ini belum ditinjau oleh moderator skrip, dan kepatuhannya terhadap Tata Tertib belum dipastikan. TradingView TIDAK menyarankan untuk membayar atau menggunakan skrip kecuali Anda sepenuhnya mempercayai pembuatnya dan memahami cara kerjanya. Anda juga dapat menemukan alternatif yang gratis dan sumber terbuka di skrip komunitas kami.
Instruksi penulis
app.blockunity.io/
unyx-data.com/
contact@blockunity.io
Pernyataan Penyangkalan
Skrip hanya-undangan
Hanya pengguna yang disetujui oleh penulis yang dapat mengakses skrip ini. Anda perlu meminta dan mendapatkan izin untuk menggunakannya. Izin ini biasanya diberikan setelah pembayaran. Untuk detail selengkapnya, ikuti petunjuk penulis di bawah ini atau hubungi Blockunity secara langsung.
Harap diperhatikan bahwa skrip pribadi khusus undangan ini belum ditinjau oleh moderator skrip, dan kepatuhannya terhadap Tata Tertib belum dipastikan. TradingView TIDAK menyarankan untuk membayar atau menggunakan skrip kecuali Anda sepenuhnya mempercayai pembuatnya dan memahami cara kerjanya. Anda juga dapat menemukan alternatif yang gratis dan sumber terbuka di skrip komunitas kami.
Instruksi penulis
app.blockunity.io/
unyx-data.com/
contact@blockunity.io