PROTECTED SOURCE SCRIPT
Realtime Order Bubbles — cryptomonk
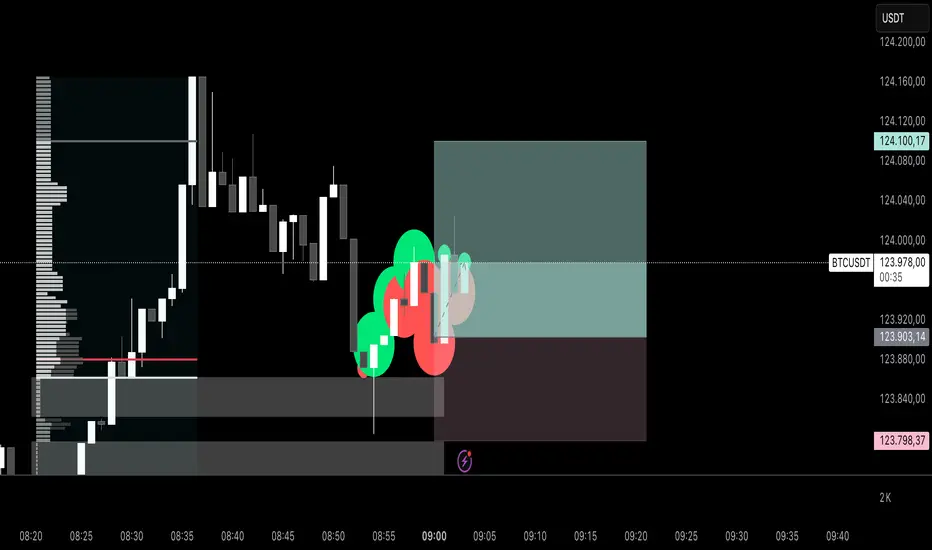
Description:
Displays real-time bubbles on the chart to visualize buy and sell activity within each candle.
• Green bubbles → Volume increase on upticks (buy pressure)
• Red bubbles → Volume increase on downticks (sell pressure)
• Bubble size → Strength of the volume change
How it works:
The indicator compares live tick updates (or bar closes) against previous volume and price values to detect whether a move was initiated by buyers or sellers, then plots bubbles in real-time accordingly.
Best used for:
• Scalping / Intraday analysis on lower timeframes (1–5 min)
• Detecting volume spikes, momentum shifts, and aggressive order flow
• Works best when chart is set to “Go Live” for tick-level updates
Use case:
A lightweight visual tool for identifying short-term order flow and understanding market pressure without needing full footprint data.
Skrip terproteksi
Skrip ini diterbitkan sebagai sumber tertutup. Namun, Anda dapat menggunakannya dengan bebas dan tanpa batasan apa pun – pelajari lebih lanjut di sini.
Pernyataan Penyangkalan
Informasi dan publikasi ini tidak dimaksudkan, dan bukan merupakan, saran atau rekomendasi keuangan, investasi, trading, atau jenis lainnya yang diberikan atau didukung oleh TradingView. Baca selengkapnya di Ketentuan Penggunaan.