OPEN-SOURCE SCRIPT
ka66: Gap Markers

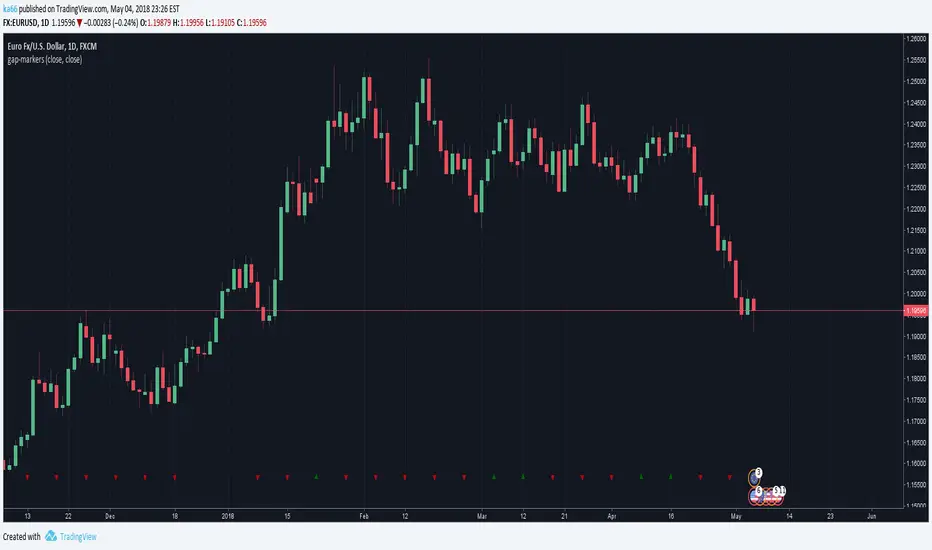
Marks bars having opening gaps, in either direction. Essentially where the opening price != closing price. The reference price defaults to close, but is configurable as an arbitrary source.
Larger gaps are easy to see visually but microgaps are more interesting, and indicate stronger shifts in sentiment, where enthusiasm towards a direction is increasing. They often signify the beginnings of strong trends.
Another signal when comparing open to high/low is a climactic type buy/sell.
Gapping is quite common in stocks, but not so much in 24H markets like Forex. It is expected this indicator has a much stronger value in these markets.
This indicator places up/down marks at the bottom of a chart, the rarity of these markers is a stronger signal than a higher frequency of occurrence.
Daily charts are likely the best spot for this indicator. Weeklies will almost always have gaps.
As usual, this is just one datapoint to consider among a confluence of others to verify a hypothesis.
Microgap Idea Credit, Price Action Course
Skrip open-source
Dengan semangat TradingView yang sesungguhnya, penulis skrip ini telah menjadikannya sumber terbuka, sehingga para trader dapat meninjau dan memverifikasi fungsinya. Hormat untuk penulisnya! Meskipun anda dapat menggunakannya secara gratis, ingatlah bahwa penerbitan ulang kode tersebut tunduk pada Tata Tertib kami.
Pernyataan Penyangkalan
Informasi dan publikasi tidak dimaksudkan untuk menjadi, dan bukan merupakan saran keuangan, investasi, perdagangan, atau rekomendasi lainnya yang diberikan atau didukung oleh TradingView. Baca selengkapnya di Persyaratan Penggunaan.