PROTECTED SOURCE SCRIPT
Aggregation Index Smoothed
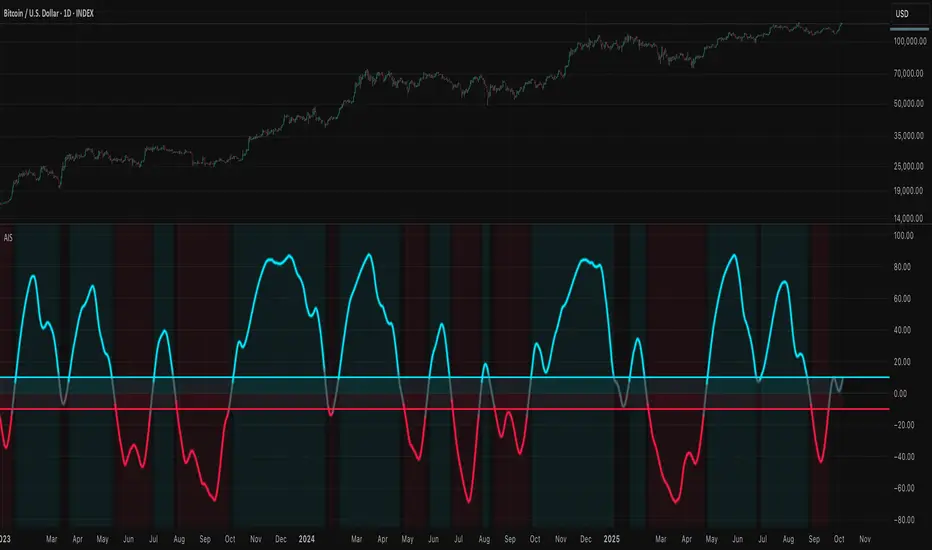
Aggregation Index Smoothed (AIS) - Multi-Method Trend Consensus Oscillator
What This Indicator Does
The Aggregation Index Smoothed combines four independent trend-detection methodologies into a unified momentum oscillator that operates across multiple timeframes simultaneously. Unlike traditional single-method indicators that can produce conflicting or false signals during market transitions, AIS requires consensus agreement across all four calculation methods before confirming trend direction.
Technical Methodology
Four-Component Loop System
Each component analyzes 16 different lookback periods (default range: 5-20 bars), creating a multi-timeframe perspective within a single calculation:
1. Price Change Analysis
Measures directional price movement across all periods. Each period scores +1 for positive change or -1 for negative change. Results are averaged and scaled to ±100.
2. RSI Multi-Period Analysis
Evaluates Relative Strength Index values across the same 16 periods. Scores +1 when RSI > 50 (momentum favoring bulls) or -1 when RSI < 50 (momentum favoring bears). This captures overbought/oversold conditions across multiple timeframes.
3. EMA Trend Position
Compares current price against Exponential Moving Averages of varying lengths (5-20 periods). Scores +1 when price trades above EMA (uptrend) or -1 when below (downtrend). This identifies trend alignment across short, medium, and longer-term moving averages.
4. Momentum Rate-of-Change
Calculates price momentum across all periods using the mom() function. Scores +1 for positive momentum or -1 for negative momentum, detecting acceleration and deceleration patterns.
Aggregation Process
Each of the four indicators independently calculates scores across all 16 periods
Individual indicator scores are averaged (range: -100 to +100)
All four indicator averages are combined using arithmetic mean
The resulting index undergoes EMA smoothing (default: 20 periods)
Optional double-smoothing applies a second EMA pass for maximum noise reduction
Why This Approach Is Unique
Problem Solved: Traditional oscillators often conflict - RSI might be bullish while MACD is bearish, or stochastic shows oversold while price trend is clearly down. Traders waste time reconciling these contradictions.
Solution: AIS eliminates conflicts by design. A bullish signal (+10 threshold) means all four methods across all 16 timeframes agree on upward momentum. This consensus approach dramatically reduces whipsaws and false signals compared to using any single method.
Technical Advantage: The for-loop methodology validates each signal across a spectrum of timeframes (5 bars through 20 bars), ensuring the trend is confirmed in both immediate-term and intermediate-term contexts. This is mathematically equivalent to running 64 separate indicators (4 methods × 16 periods) and requiring majority agreement.
Signal Generation
Long Signal (Bullish): Index crosses above +10 threshold
Indicates all four methods confirm upward momentum across multiple timeframes
Sustained readings above +10 suggest strong trend continuation
Short Signal (Bearish): Index crosses below -10 threshold
Indicates all four methods confirm downward momentum across multiple timeframes
Sustained readings below -10 suggest strong downtrend
Neutral Zone (-10 to +10): Mixed signals or consolidation
Methods disagree on direction, suggesting choppy or range-bound conditions
Avoid trend-following strategies in this zone
How to Use This Indicator
Best Practices
Timeframe Selection:
Most effective on 4-hour charts and higher (Daily, Weekly)
Lower timeframes (1H, 15m) may produce excessive signals despite smoothing
The 16-period loop range is optimized for swing trading timeframes
Entry Strategy:
Wait for index to cross threshold levels (±10)
Confirm with price action (breakout, support/resistance levels)
Consider entering on first pullback after threshold cross for better risk/reward
Parameter Adjustment:
Volatile instruments (crypto, small-caps): Increase thresholds to ±15 or ±20 to filter noise
Stable instruments (large-cap stocks, indices): Reduce thresholds to ±5 for earlier signals
Smoothing Length: Increase to 30+ for cleaner signals; decrease to 10-15 for faster response
Double Smoothing: Keep enabled for trend following; disable for more reactive signals
Risk Management:
Exit longs when index drops back into neutral zone (below +10)
Exit shorts when index rises into neutral zone (above -10)
Use index slope as trend strength indicator (steeper = stronger)
Interpretation Guidelines
Strong Trending Conditions:
Index sustained above +50 or below -50 indicates powerful directional move
All four methods showing extreme agreement across all timeframes
High probability of trend continuation
Trend Exhaustion Signals:
Index reaches extreme levels (+80 to +100 or -80 to -100)
Potential reversal zone; watch for divergence with price
Consider taking partial profits on existing positions
Divergence Detection:
Price makes new highs while index fails to confirm = bearish divergence
Price makes new lows while index shows higher lows = bullish divergence
Divergences on 4H+ timeframes carry significant weight
Limitations and Considerations
Not Suitable For:
Scalping or very short-term trading (under 1-hour timeframes)
Range-bound markets with no clear trend (index oscillates in neutral zone)
Instruments with erratic, news-driven price action
Known Lag:
Double smoothing introduces 40+ bar delay in signal generation
Designed for trend confirmation, not early trend detection
Fast market reversals may produce late exit signals
Complementary Tools:
Combine with support/resistance levels for entry precision
Use with volume analysis to confirm signal strength
Pair with volatility indicators (ATR) for position sizing
Technical Implementation Notes
The indicator pre-calculates all RSI and EMA values for lengths 5-20 to comply with Pine Script's requirement for constant-length parameters in ta.rsi() and ta.ema() functions. This workaround allows dynamic loop-based analysis while maintaining calculation consistency on every bar.
The scoring methodology uses binary classification (+1/-1) rather than normalized percentage values to ensure equal weighting across all four methods, preventing any single indicator from dominating the aggregate signal.
Summary: The Aggregation Index Smoothed provides trend confirmation through multi-method consensus across variable timeframes. Its primary value is eliminating the confusion of conflicting indicator signals by requiring agreement from four independent trend calculations before generating actionable signals. Best suited for swing traders and position traders on 4-hour and higher timeframes seeking high-probability trend-following entries with reduced false signals.
Skrip terproteksi
Skrip ini diterbitkan sebagai sumber tertutup. Namun, Anda dapat menggunakannya dengan bebas dan tanpa batasan apa pun – pelajari lebih lanjut di sini.
Pernyataan Penyangkalan
Informasi dan publikasi ini tidak dimaksudkan, dan bukan merupakan, saran atau rekomendasi keuangan, investasi, trading, atau jenis lainnya yang diberikan atau didukung oleh TradingView. Baca selengkapnya di Ketentuan Penggunaan.