OPEN-SOURCE SCRIPT
Correlation
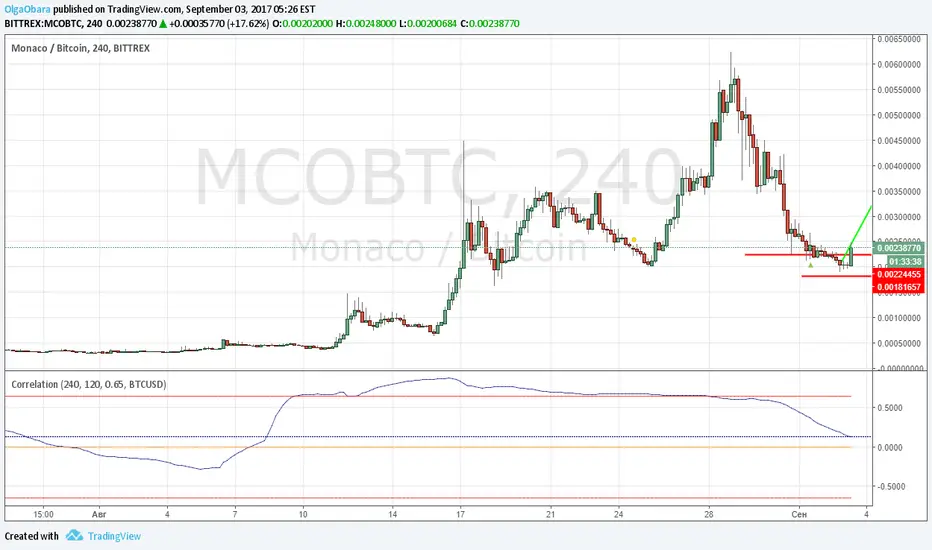
Graph shows level of correlation between current source and another one and track current value of it. User can select source for comparison, graph period and number of candles for calculation, enter level of significal correlation (+-0.65 by default). Grapf contains 4 plots: Correlation - current level of correlation, Zero line , +Corr_level - minimum level of significant positive correlation, -Corr_level -maximum level of significant negative correlation between 2 sources.
Skrip open-source
Dengan semangat TradingView yang sesungguhnya, pembuat skrip ini telah menjadikannya sebagai sumber terbuka, sehingga para trader dapat meninjau dan memverifikasi fungsinya. Salut untuk penulisnya! Meskipun Anda dapat menggunakannya secara gratis, perlu diingat bahwa penerbitan ulang kode ini tunduk pada Tata Tertib kami.
Pernyataan Penyangkalan
Informasi dan publikasi ini tidak dimaksudkan, dan bukan merupakan, saran atau rekomendasi keuangan, investasi, trading, atau jenis lainnya yang diberikan atau didukung oleh TradingView. Baca selengkapnya di Ketentuan Penggunaan.