OPEN-SOURCE SCRIPT
Diupdate 3cf
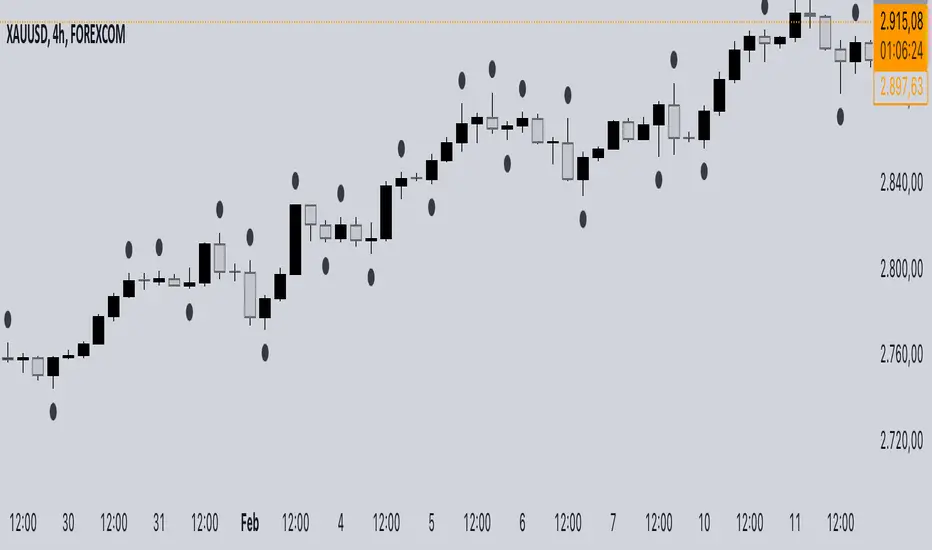
This indicator identifies and signals the points of swing highs and swing lows on the price chart using an algorithm based on market structure. Local highs and lows are highlighted with a colored dot, making it easier to perform technical analysis and recognize trend reversals.
The indicator analyzes a predefined number of bars (e.g., 5 candles) to determine relative highs and lows:
Swing High (Local High) → The current candle has a higher high compared to the previous and subsequent candle.
Swing Low (Local Low) → The current candle has a lower low compared to the previous and subsequent candle.
When a candle meets one of these conditions, a visual dot is placed to indicate the potential reversal point.
Catatan Rilis
Added a toggle option to enable or disable the display of local highs and lows in the script. This is done using an input(true, title="Show max/min") checkbox, which allows users to control whether the plotted markers for highs and lows are shown. The plotshape functions are modified to check the enableDisplay variable, ensuring that the circles are only drawn when the option is enabled.Skrip open-source
Dengan semangat TradingView yang sesungguhnya, pembuat skrip ini telah menjadikannya sebagai sumber terbuka, sehingga para trader dapat meninjau dan memverifikasi fungsinya. Salut untuk penulisnya! Meskipun Anda dapat menggunakannya secara gratis, perlu diingat bahwa penerbitan ulang kode ini tunduk pada Tata Tertib kami.
Pernyataan Penyangkalan
Informasi dan publikasi ini tidak dimaksudkan, dan bukan merupakan, saran atau rekomendasi keuangan, investasi, trading, atau jenis lainnya yang diberikan atau didukung oleh TradingView. Baca selengkapnya di Ketentuan Penggunaan.
Skrip open-source
Dengan semangat TradingView yang sesungguhnya, pembuat skrip ini telah menjadikannya sebagai sumber terbuka, sehingga para trader dapat meninjau dan memverifikasi fungsinya. Salut untuk penulisnya! Meskipun Anda dapat menggunakannya secara gratis, perlu diingat bahwa penerbitan ulang kode ini tunduk pada Tata Tertib kami.
Pernyataan Penyangkalan
Informasi dan publikasi ini tidak dimaksudkan, dan bukan merupakan, saran atau rekomendasi keuangan, investasi, trading, atau jenis lainnya yang diberikan atau didukung oleh TradingView. Baca selengkapnya di Ketentuan Penggunaan.