OPEN-SOURCE SCRIPT
Gradiente
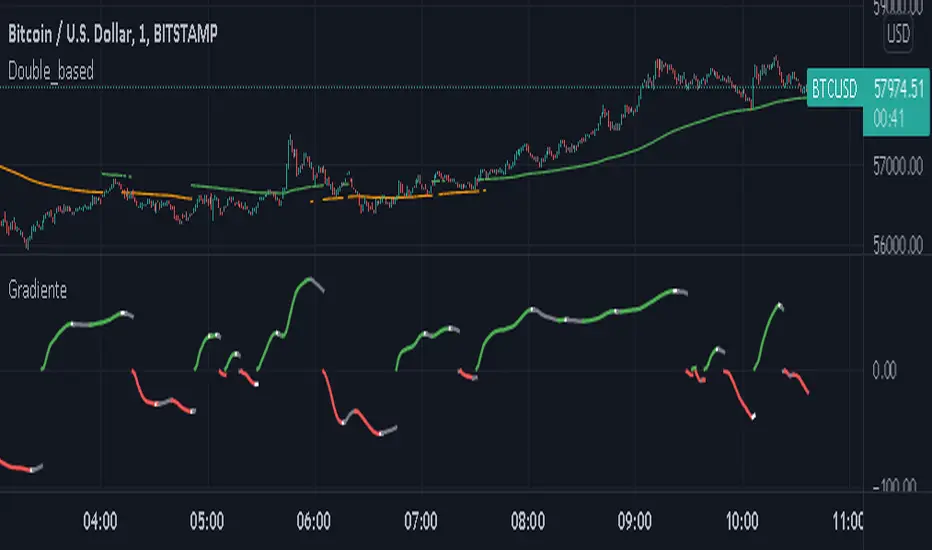
This indicator works in following concep. In a trend the area between two EMA increases as the trend go forward. When the trend loose strenth the fast EMA is the first to slow down and the area betwenn the EMA stop to increase indicating a lost of momentum.
The gradient is the division of the area formed between the EMA by the number of bars it contains.
In a up-trend is above 0.
In a down-trend is below 0.
The color green in the up trend shows the strenth is on, the white color shows the momentum is weaking.
The color red in the down trend shows the strenth is on, the white color shows the momentum is weaking.
Is necessary to plot the same EMA periods on the chart price to compare the strenth.
Skrip open-source
Dengan semangat TradingView yang sesungguhnya, pembuat skrip ini telah menjadikannya sebagai sumber terbuka, sehingga para trader dapat meninjau dan memverifikasi fungsinya. Salut untuk penulisnya! Meskipun Anda dapat menggunakannya secara gratis, perlu diingat bahwa penerbitan ulang kode ini tunduk pada Tata Tertib kami.
Pernyataan Penyangkalan
Informasi dan publikasi ini tidak dimaksudkan, dan bukan merupakan, saran atau rekomendasi keuangan, investasi, trading, atau jenis lainnya yang diberikan atau didukung oleh TradingView. Baca selengkapnya di Ketentuan Penggunaan.