OPEN-SOURCE SCRIPT
ARVELOV EMA 8,15,40,200,400 + ORB + Intersection Dots
ARVELOV EMA 8,15,40,200,400 + ORB + Intersection Dots
Description:
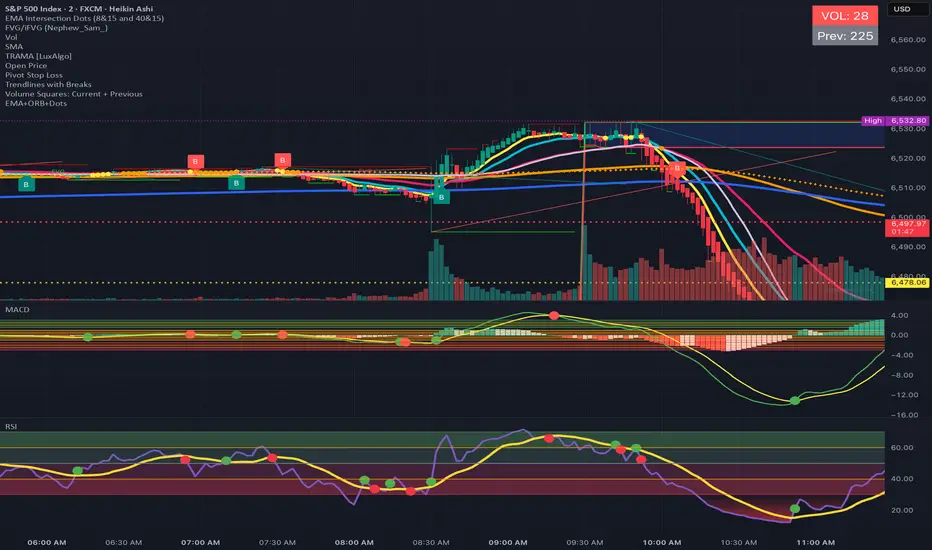
This powerful multi-strategy TradingView indicator combines multiple technical analysis tools into a single, easy-to-read overlay. It is designed for traders who want to track key exponential moving averages (EMAs), monitor opening range breakouts (ORB), and identify critical EMA intersections that can signal potential trend changes.
Features:
Exponential Moving Averages (EMAs):
Plots 5 EMAs (8, 15, 40, 200, 400) directly on the chart.
Each EMA has a distinct, customizable color for easy visualization.
Helps identify short-term, medium-term, and long-term trend directions.
Opening Range Breakout (ORB):
Calculates the high and low of a selected session (default: 09:30–09:45).
Highlights the area between ORB high and low with a semi-transparent fill.
Works with intraday charts and can be restricted by maximum timeframe/minutes.
Helps traders spot early breakout opportunities and key support/resistance levels.
EMA Intersection Dots:
Detects intersections between EMA 8 & 15 (short-term) and EMA 40 & 15 (medium-term).
Plots small, distinct dots at intersection points on the chart.
Includes alert conditions to notify traders when intersections occur.
Can be used to identify trend reversals, momentum shifts, or potential entry points.
Customizable Inputs:
EMA lengths and intersection tolerance percentages can be adjusted.
ORB session time and duration can be customized.
Usage:
Ideal for day traders and swing traders looking for trend confirmation and breakout signals.
Combines trend analysis (EMAs), breakout detection (ORB), and intersection-based alerts for enhanced trading decisions.
Works best on intraday charts, but long-term EMAs are visible on higher timeframes as well.
Benefits:
Single, unified script with multiple indicators reduces chart clutter.
Visual cues (EMAs, ORB fill, intersection dots) make it easier to analyze market behavior.
Alerts help traders stay proactive without constantly monitoring the chart.
Description:
This powerful multi-strategy TradingView indicator combines multiple technical analysis tools into a single, easy-to-read overlay. It is designed for traders who want to track key exponential moving averages (EMAs), monitor opening range breakouts (ORB), and identify critical EMA intersections that can signal potential trend changes.
Features:
Exponential Moving Averages (EMAs):
Plots 5 EMAs (8, 15, 40, 200, 400) directly on the chart.
Each EMA has a distinct, customizable color for easy visualization.
Helps identify short-term, medium-term, and long-term trend directions.
Opening Range Breakout (ORB):
Calculates the high and low of a selected session (default: 09:30–09:45).
Highlights the area between ORB high and low with a semi-transparent fill.
Works with intraday charts and can be restricted by maximum timeframe/minutes.
Helps traders spot early breakout opportunities and key support/resistance levels.
EMA Intersection Dots:
Detects intersections between EMA 8 & 15 (short-term) and EMA 40 & 15 (medium-term).
Plots small, distinct dots at intersection points on the chart.
Includes alert conditions to notify traders when intersections occur.
Can be used to identify trend reversals, momentum shifts, or potential entry points.
Customizable Inputs:
EMA lengths and intersection tolerance percentages can be adjusted.
ORB session time and duration can be customized.
Usage:
Ideal for day traders and swing traders looking for trend confirmation and breakout signals.
Combines trend analysis (EMAs), breakout detection (ORB), and intersection-based alerts for enhanced trading decisions.
Works best on intraday charts, but long-term EMAs are visible on higher timeframes as well.
Benefits:
Single, unified script with multiple indicators reduces chart clutter.
Visual cues (EMAs, ORB fill, intersection dots) make it easier to analyze market behavior.
Alerts help traders stay proactive without constantly monitoring the chart.
Skrip open-source
Dengan semangat TradingView yang sesungguhnya, penulis skrip ini telah menjadikannya sumber terbuka, sehingga para trader dapat meninjau dan memverifikasi fungsinya. Hormat untuk penulisnya! Meskipun anda dapat menggunakannya secara gratis, ingatlah bahwa penerbitan ulang kode tersebut tunduk pada Tata Tertib kami.
Pernyataan Penyangkalan
Informasi dan publikasi tidak dimaksudkan untuk menjadi, dan bukan merupakan saran keuangan, investasi, perdagangan, atau rekomendasi lainnya yang diberikan atau didukung oleh TradingView. Baca selengkapnya di Persyaratan Penggunaan.