OPEN-SOURCE SCRIPT
Dynamic SMA
Timeframe Detection: The indicator first identifies the current timeframe of the chart (e.g., daily, 4-hour, 1-hour).
SMA Calculation: It calculates three different SMAs:
Daily SMA: A 8-period SMA calculated on daily closing prices.
4-Hour SMA: A 50-period SMA calculated on 4-hour closing prices.
1-Hour SMA: A 100-period SMA calculated on 1-hour closing prices.
Dynamic SMA Selection: Based on the detected timeframe, the indicator selects the appropriate SMA to display:
If the timeframe is daily, it uses the daily SMA.
If the timeframe is 4-hour, it uses the 4-hour SMA.
If the timeframe is 1-hour, it uses the 1-hour SMA.
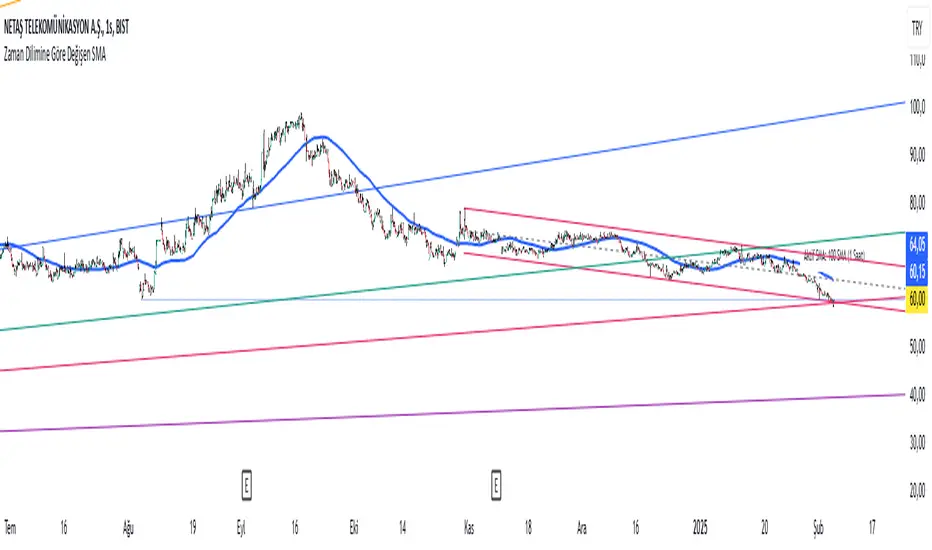
Plotting: The selected SMA is plotted on the chart as a blue line.
Dynamic Label: The indicator also creates a dynamic label that displays the current SMA being used, along with the corresponding timeframe and period. For example, it will show "Active SMA: 8 SMA (Daily)" when the daily SMA is active.
This indicator is useful for traders who want to use different SMAs for different timeframes without having to manually switch between them. It provides a convenient way to see the relevant SMA for the current chart view.
SMA Calculation: It calculates three different SMAs:
Daily SMA: A 8-period SMA calculated on daily closing prices.
4-Hour SMA: A 50-period SMA calculated on 4-hour closing prices.
1-Hour SMA: A 100-period SMA calculated on 1-hour closing prices.
Dynamic SMA Selection: Based on the detected timeframe, the indicator selects the appropriate SMA to display:
If the timeframe is daily, it uses the daily SMA.
If the timeframe is 4-hour, it uses the 4-hour SMA.
If the timeframe is 1-hour, it uses the 1-hour SMA.
Plotting: The selected SMA is plotted on the chart as a blue line.
Dynamic Label: The indicator also creates a dynamic label that displays the current SMA being used, along with the corresponding timeframe and period. For example, it will show "Active SMA: 8 SMA (Daily)" when the daily SMA is active.
This indicator is useful for traders who want to use different SMAs for different timeframes without having to manually switch between them. It provides a convenient way to see the relevant SMA for the current chart view.
Skrip open-source
Dengan semangat TradingView yang sesungguhnya, pembuat skrip ini telah menjadikannya sebagai sumber terbuka, sehingga para trader dapat meninjau dan memverifikasi fungsinya. Salut untuk penulisnya! Meskipun Anda dapat menggunakannya secara gratis, perlu diingat bahwa penerbitan ulang kode ini tunduk pada Tata Tertib kami.
Pernyataan Penyangkalan
Informasi dan publikasi ini tidak dimaksudkan, dan bukan merupakan, saran atau rekomendasi keuangan, investasi, trading, atau jenis lainnya yang diberikan atau didukung oleh TradingView. Baca selengkapnya di Ketentuan Penggunaan.