OPEN-SOURCE SCRIPT
MA Extension
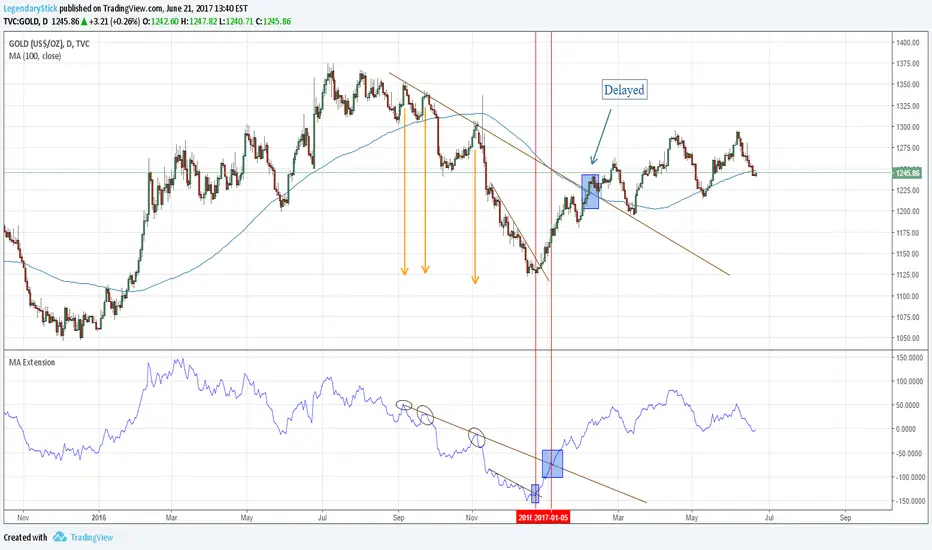
This indicator measures the vertical distance form the current close to the MA of your choice. I find that it does not work best as an oscillator, but it works well for providing early signals for taking profits when trend continuating. For example, if you go short due to a retracement to the MA (of your choice) take profits when a bearish trendline is broken (signalling the start of a bullish correction) that corresponds to the highs of the chart. The logic behind this indicator is that the breakouts of trendlines of an assets difference from an MA will precede corresponding breakouts of trendlines drawn on raw price. Kind of like Momentum, except it takes trend into account. Momentum has the same leading feature when it comes to drawing trendlines , but trendlines will be harder to draw due to the Momentum indicators oscillatory behavior.
Skrip open-source
Dengan semangat TradingView yang sesungguhnya, pembuat skrip ini telah menjadikannya sebagai sumber terbuka, sehingga para trader dapat meninjau dan memverifikasi fungsinya. Salut untuk penulisnya! Meskipun Anda dapat menggunakannya secara gratis, perlu diingat bahwa penerbitan ulang kode ini tunduk pada Tata Tertib kami.
Pernyataan Penyangkalan
Informasi dan publikasi ini tidak dimaksudkan, dan bukan merupakan, saran atau rekomendasi keuangan, investasi, trading, atau jenis lainnya yang diberikan atau didukung oleh TradingView. Baca selengkapnya di Ketentuan Penggunaan.