PROTECTED SOURCE SCRIPT
NUPL Z-Score
NUPL Z-Score
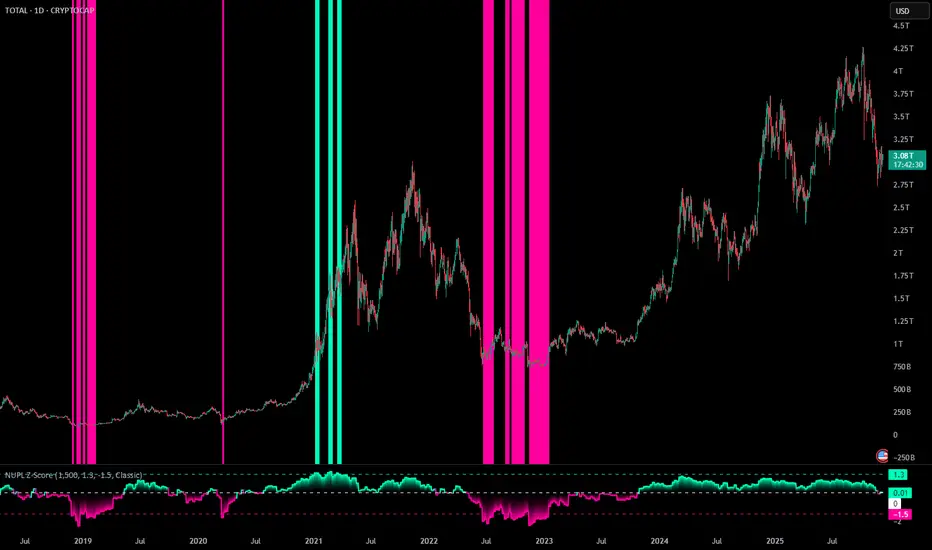
The Net Unrealized Profit and Loss (NUPL) is an advanced on-chain indicator that is measured by subtracting the Realized Value from Market Value. Realized Value takes the price of each Bitcoin when it was last moved. It adds up all individual prices and takes an average. It multiplies that average price by the total number of coins in circulation. Market Value is the current price of Bitcoin multiplied by the number of coins in circulation. This gives us the NUPL which estimates the total paper profits/losses in Bitcoin held by investors. This indicator enhances this metric by normalizing it into a Z-score, and enabling customizable features for precision and visualization.
This indicator is calibrated on a weekly timeframe in order to give precise top and bottom signals for each cycle.
Features
The script compares the Z-score with customizable threshold levels to generate overbought and oversold levels. A Z-score exceeding the upper threshold suggests potential overbought conditions, while a Z-score below the lower threshold may indicate oversold conditions.
This script offers several customizable inputs, enabling traders to tailor the indicator to their preferences. The length determines the lookback period that the Z-score is calculated over. Traders can also adjust the thresholds to define the sensitivity of overbought and oversold conditions.
It has 10 available color schemes to choose from and the background coloring on the chart can be toggled on and off.
Practical Applications
This indicator is designed for traders who focus on identifying cycle extremes and potential mean reversion opportunities. By using Z-score analysis, this tool can be particularly effective for detecting points of overextension in the market, where a reversion to the mean is likely.
Detecting Overbought and Oversold Conditions: The Z-score measures how far the price has deviated from its norm, allowing traders to identify overbought or oversold conditions with precision.
Timing Market Reversals: The indicator provides early signals of potential market reversals by highlighting when the price has moved too far away from its average, helping traders anticipate reversion opportunities.
Skrip terproteksi
Skrip ini diterbitkan sebagai sumber tertutup. Namun, Anda dapat menggunakannya dengan bebas dan tanpa batasan apa pun – pelajari lebih lanjut di sini.
Pernyataan Penyangkalan
Informasi dan publikasi ini tidak dimaksudkan, dan bukan merupakan, saran atau rekomendasi keuangan, investasi, trading, atau jenis lainnya yang diberikan atau didukung oleh TradingView. Baca selengkapnya di Ketentuan Penggunaan.