OPEN-SOURCE SCRIPT
Diupdate Morning Break Out
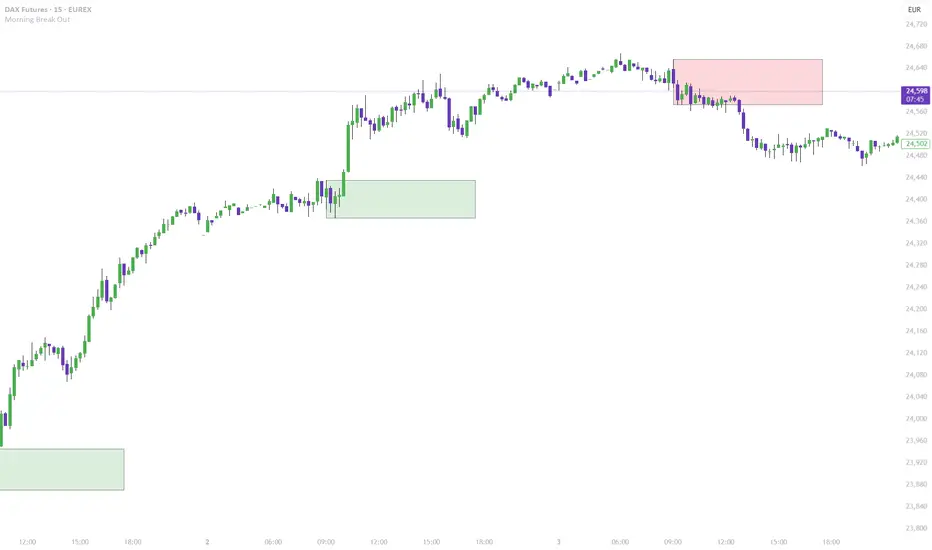
This indicator visualizes a classic morning breakout setup for the DAX and other European markets. The first hour often sets the tone for the trading day — this tool helps you identify that visually and react accordingly.
🔍 How It Works:
Box Range Calculation:
The high and low between 09:00 and 10:00 define the top and bottom of the box.
Color Logic:
Green: Price breaks above the box after 10:00 → bullish breakout
Red: Price breaks below the box after 10:00 → bearish breakout
Gray: No breakout → neutral phase
📈 Use Cases:
Identify breakout setups visually
Ideal for intraday traders and momentum strategies
Combine with volume or trend filters
⚙️ Notes:
Recommended for timeframes 1-minute and above
Uses the chart’s local timezone (e.g. CET/CEST for XETRA/DAX)
Works on all instruments with data before 09:00 — perfect for DAX, EuroStoxx, futures, FX, CFDs, etc.
Catatan Rilis
This indicator visualizes a classic morning breakout setup for the DAX and other European markets. The first hour often sets the tone for the trading day — this tool helps you identify that visually and react accordingly.🔍 How It Works:
Box Range Calculation:
The high and low between 09:00 and 10:00 define the top and bottom of the box.
Color Logic:
Green: Price breaks above the box after 10:00 → bullish breakout
Red: Price breaks below the box after 10:00 → bearish breakout
Gray: No breakout → neutral phase
📈 Use Cases:
Identify breakout setups visually
Ideal for intraday traders and momentum strategies
Combine with volume or trend filters
⚙️ Notes:
Recommended for timeframes 1-minute and above
Uses the chart’s local timezone (e.g. CET/CEST for XETRA/DAX)
Works on all instruments with data before 09:00 — perfect for DAX, EuroStoxx, futures, FX, CFDs, etc.
Skrip open-source
Dengan semangat TradingView yang sesungguhnya, pembuat skrip ini telah menjadikannya sebagai sumber terbuka, sehingga para trader dapat meninjau dan memverifikasi fungsinya. Salut untuk penulisnya! Meskipun Anda dapat menggunakannya secara gratis, perlu diingat bahwa penerbitan ulang kode ini tunduk pada Tata Tertib kami.
Pernyataan Penyangkalan
Informasi dan publikasi ini tidak dimaksudkan, dan bukan merupakan, saran atau rekomendasi keuangan, investasi, trading, atau jenis lainnya yang diberikan atau didukung oleh TradingView. Baca selengkapnya di Ketentuan Penggunaan.