OPEN-SOURCE SCRIPT
Diupdate MA and Channel overlay
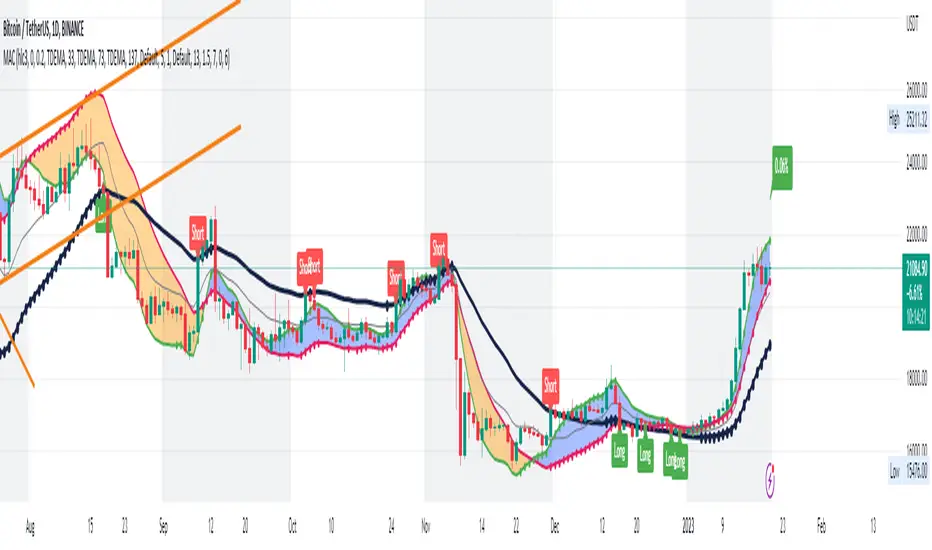
Some overlay utilities:
- Draw 3 moving averages (MA) with circles line.
- Option to choose type of MA to plot.
- Draw start point of those MA with a big cross.
- Option to draw channel: Donchian, Bollinger and Envelope.
- Option to draw stop loss line: ATR or Percentage.
- Draw background color in monthly, weekly, daily, intraday, ... chart (remember to choose your correct timezone if using intraday chart).
- Draw a label of last price.
- Draw next prices.
Catatan Rilis
Added comments and showed stop loss line for demo purpose.Catatan Rilis
Option to show / hide MAs.Catatan Rilis
New chart view.Catatan Rilis
Add intraday labels which show day number in month and weekday name.Catatan Rilis
Add hour range to draw sleep time in intraday chart.Catatan Rilis
Fixed time zone issue for exchange that has non-UTC timezone.Catatan Rilis
Fix weekly background issue.Catatan Rilis
Fix channel len issue.Catatan Rilis
- Use TDEMA as the default MA now.- Use bigger periods to catch trend easier.
- Drawed a band between small and medium period (MA1 and MA2) lines.
- The position of this band and the big period line (MA3) is the key to check the trend now.
Skrip open-source
Dengan semangat TradingView yang sesungguhnya, pembuat skrip ini telah menjadikannya sebagai sumber terbuka, sehingga para trader dapat meninjau dan memverifikasi fungsinya. Salut untuk penulisnya! Meskipun Anda dapat menggunakannya secara gratis, perlu diingat bahwa penerbitan ulang kode ini tunduk pada Tata Tertib kami.
Pernyataan Penyangkalan
Informasi dan publikasi ini tidak dimaksudkan, dan bukan merupakan, saran atau rekomendasi keuangan, investasi, trading, atau jenis lainnya yang diberikan atau didukung oleh TradingView. Baca selengkapnya di Ketentuan Penggunaan.