OPEN-SOURCE SCRIPT
Pearson Correlation Coefficient
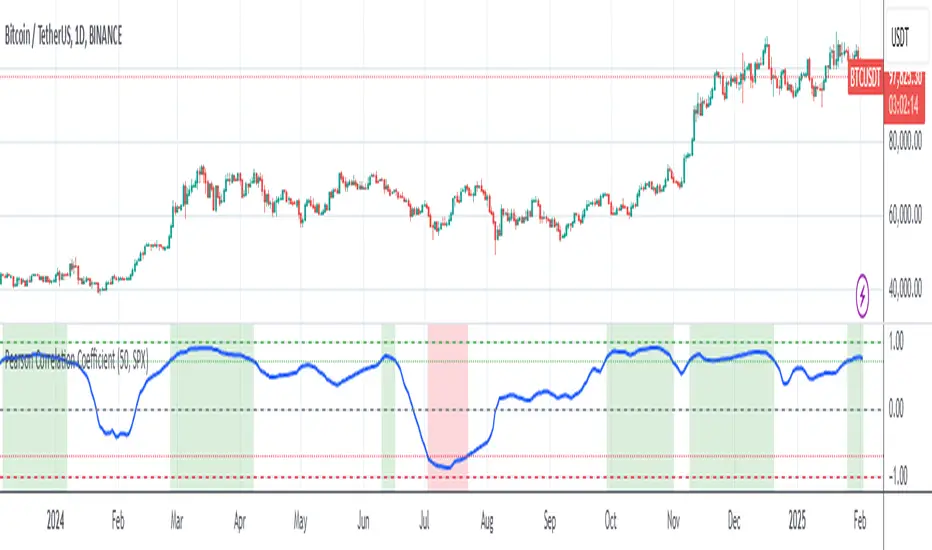
Description: The Pearson Correlation Coefficient measures the strength and direction of the linear relationship between two data series. Its value ranges from -1 to +1, where:
This measure is widely used in technical analysis to assess the degree of correlation between two financial assets. The "Pearson Correlation (Manual Compare)" indicator allows users to manually select two assets and visually display their correlation relationship on a chart.
Features:
How to Select the Second Asset:
This indicator is ideal for traders looking to identify relationships and correlations between different financial assets to make informed trading decisions.
- +1 indicates a perfect positive linear correlation: as one asset increases, the other asset increases proportionally.
- 0 indicates no linear correlation: variations in one asset have no relation to variations in the other asset.
- -1 indicates a perfect negative linear correlation: as one asset increases, the other asset decreases proportionally.
This measure is widely used in technical analysis to assess the degree of correlation between two financial assets. The "Pearson Correlation (Manual Compare)" indicator allows users to manually select two assets and visually display their correlation relationship on a chart.
Features:
- Correlation Period: The time period used for calculating the correlation can be adjusted (default: 50).
- Comparison Asset: Users can select a secondary asset for comparison.
- Visual Plots: The chart includes reference lines for perfect correlations (+1 and -1) and strong correlations (+0.7 and -0.7).
- Alerts: Set alerts for when the correlation exceeds certain threshold values (e.g., +0.7 for strong positive correlation).
How to Select the Second Asset:
- Primary Asset Selection: The primary asset is the one you select for viewing on the chart. This can be done by simply opening the chart for the desired asset.
- Secondary Asset Selection: To select the secondary asset for comparison, use the input field labeled "Comparison Asset" in the script settings. You can manually enter the ticker symbol of the secondary asset you want to compare with the primary asset.
This indicator is ideal for traders looking to identify relationships and correlations between different financial assets to make informed trading decisions.
Skrip open-source
Dengan semangat TradingView yang sesungguhnya, pembuat skrip ini telah menjadikannya sebagai sumber terbuka, sehingga para trader dapat meninjau dan memverifikasi fungsinya. Salut untuk penulisnya! Meskipun Anda dapat menggunakannya secara gratis, perlu diingat bahwa penerbitan ulang kode ini tunduk pada Tata Tertib kami.
Pernyataan Penyangkalan
Informasi dan publikasi ini tidak dimaksudkan, dan bukan merupakan, saran atau rekomendasi keuangan, investasi, trading, atau jenis lainnya yang diberikan atau didukung oleh TradingView. Baca selengkapnya di Ketentuan Penggunaan.