PROTECTED SOURCE SCRIPT
Daily SMA200 Distance - Percentile Zones
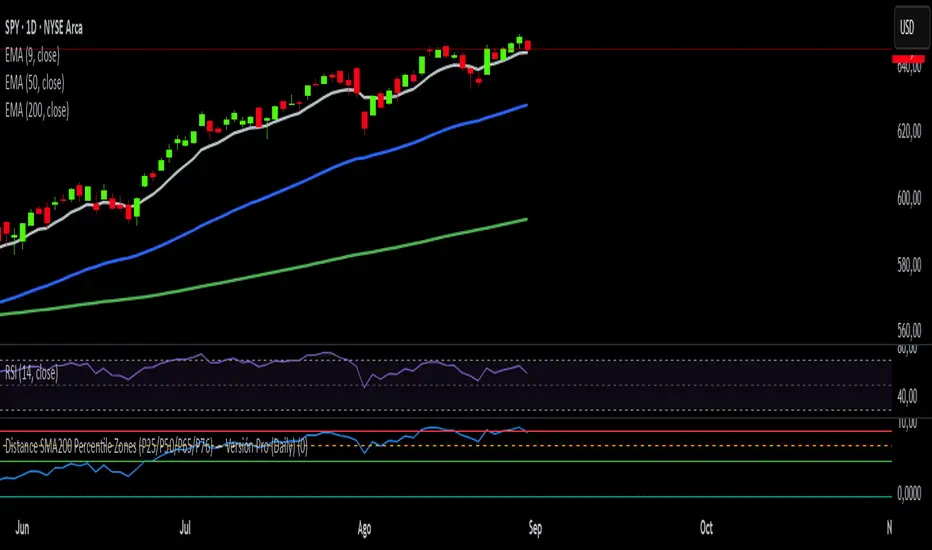
The Daily SMA200 Distance – Percentile Zones indicator measures the percentage distance of price relative to the 200-day Simple Moving Average (SMA200) and classifies it into historical percentile zones.
This tool helps identify the context of an asset in relation to its medium- to long-term trend:
Cheap Zone (< P25): price at historically low levels relative to the SMA200.
Value Zone (P25–P50): neutral range, where price trades around its medium-term average.
Acceptable Zone (P50–P65): moderately high levels, still reasonable within an uptrend.
Not Recommended Zone (P65–P76): overextended territory with rising correction risk.
Very Expensive Zone (≥ P76): extreme levels, historically linked to overvaluation and potential market tops.
Percentile calculations update dynamically with each new daily candle, providing a robust and objective statistical perspective for swing trading and portfolio management decisions.
Skrip terproteksi
Skrip ini diterbitkan sebagai sumber tertutup. Namun, anda dapat menggunakannya secara bebas dan tanpa batasan apa pun – pelajari lebih lanjut di sini.
Pernyataan Penyangkalan
Informasi dan publikasi tidak dimaksudkan untuk menjadi, dan bukan merupakan saran keuangan, investasi, perdagangan, atau rekomendasi lainnya yang diberikan atau didukung oleh TradingView. Baca selengkapnya di Persyaratan Penggunaan.